2018 Vol.30(4)
Display Mode: |
2018, 30(4): 395-395.
doi: 10.21147/j.issn.1000-9604.2018.04.01
 Abstract
 FullText HTML
Abstract:
2018, 30(4): 396-405.
doi: 10.21147/j.issn.1000-9604.2018.04.02
 PDF 2034KB
Abstract:
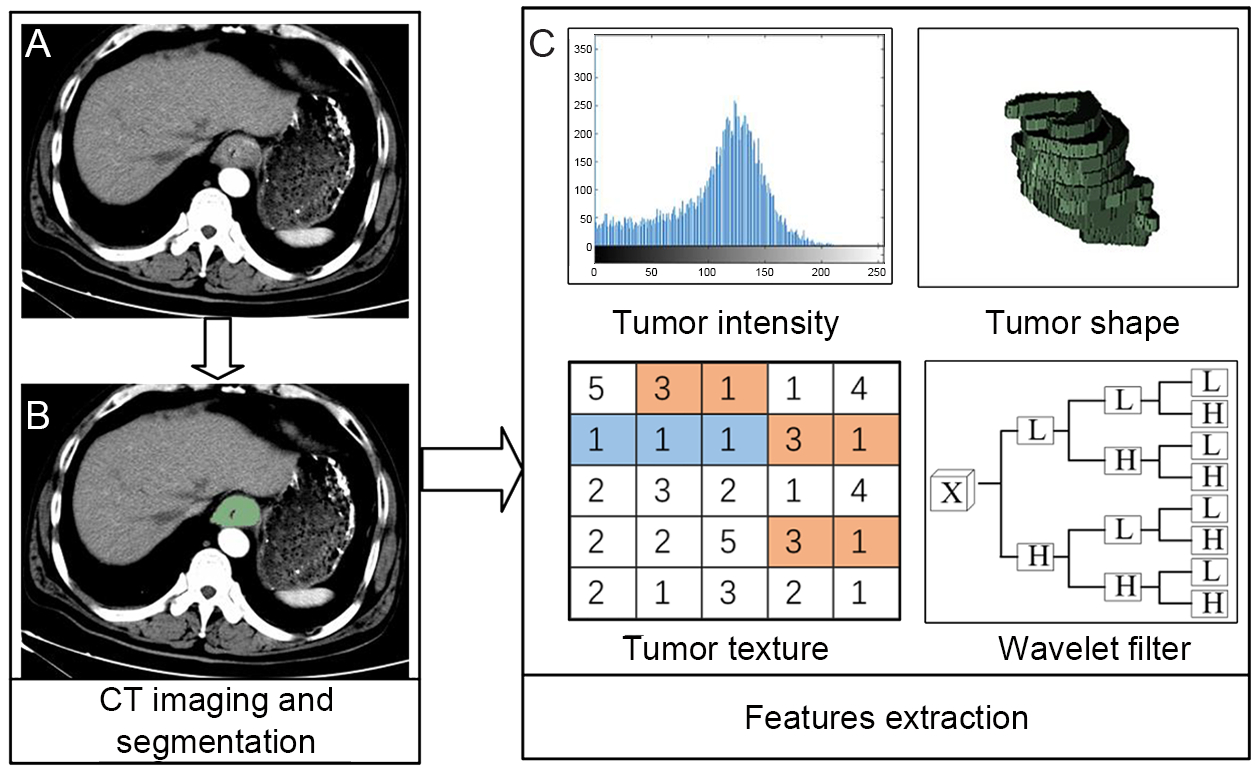
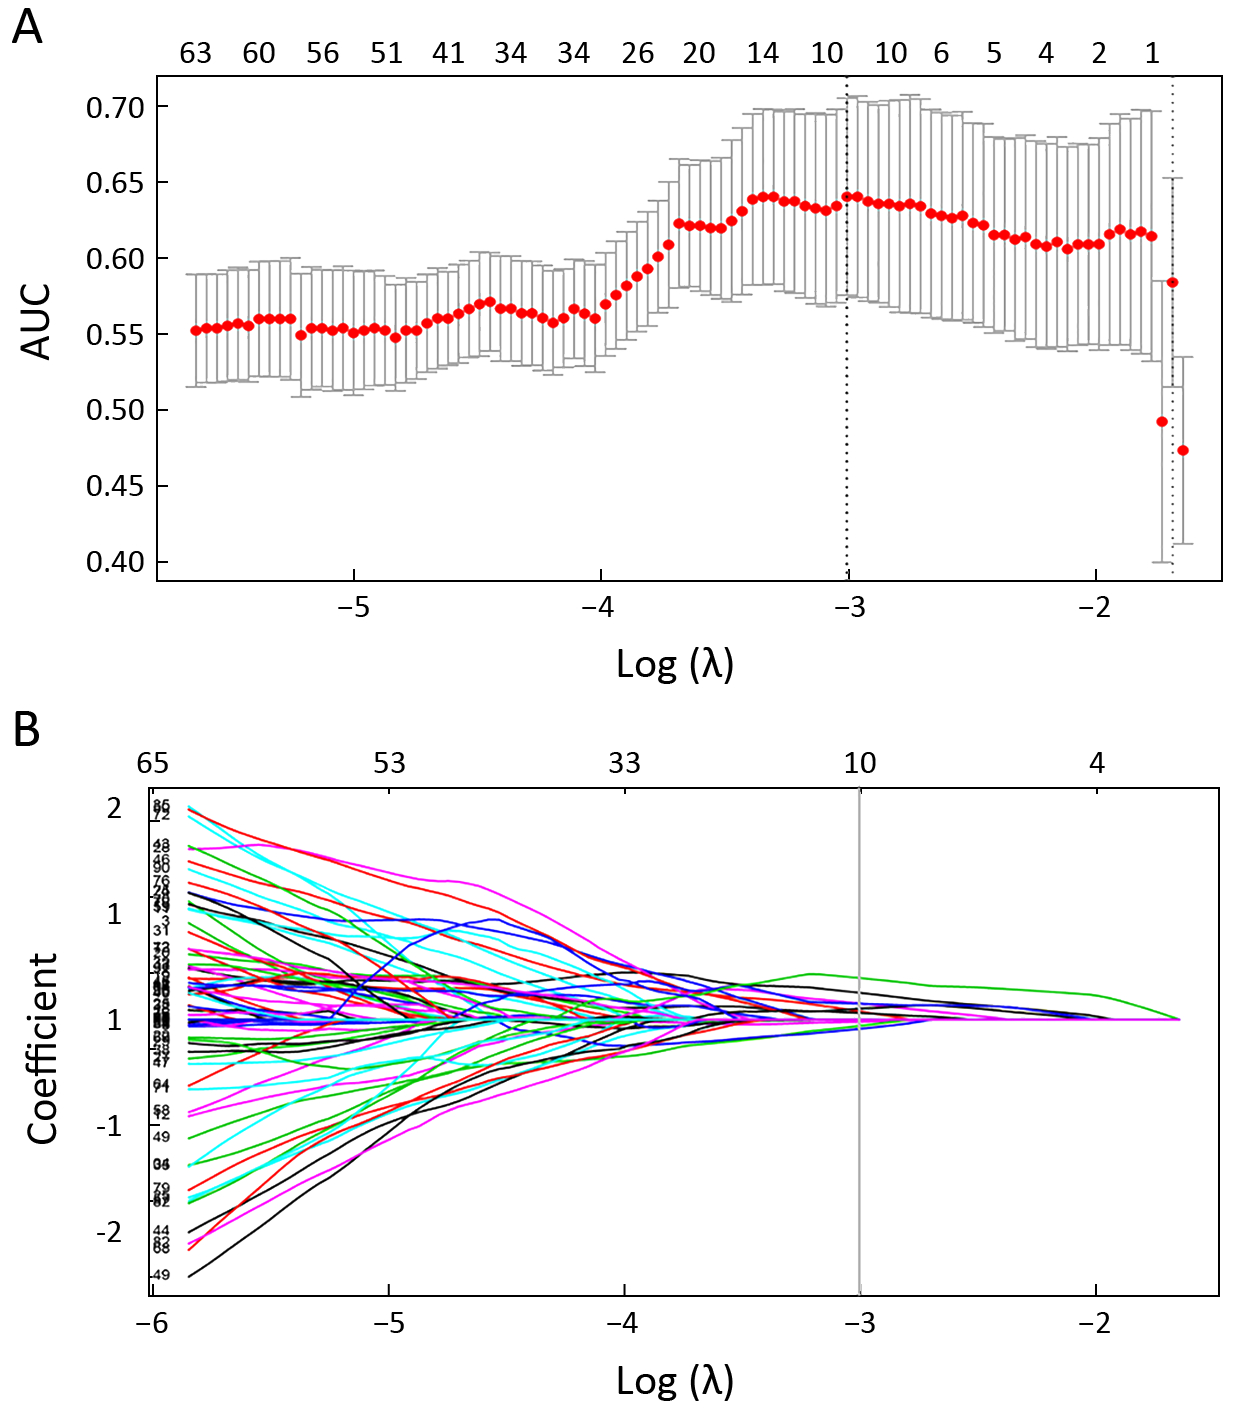
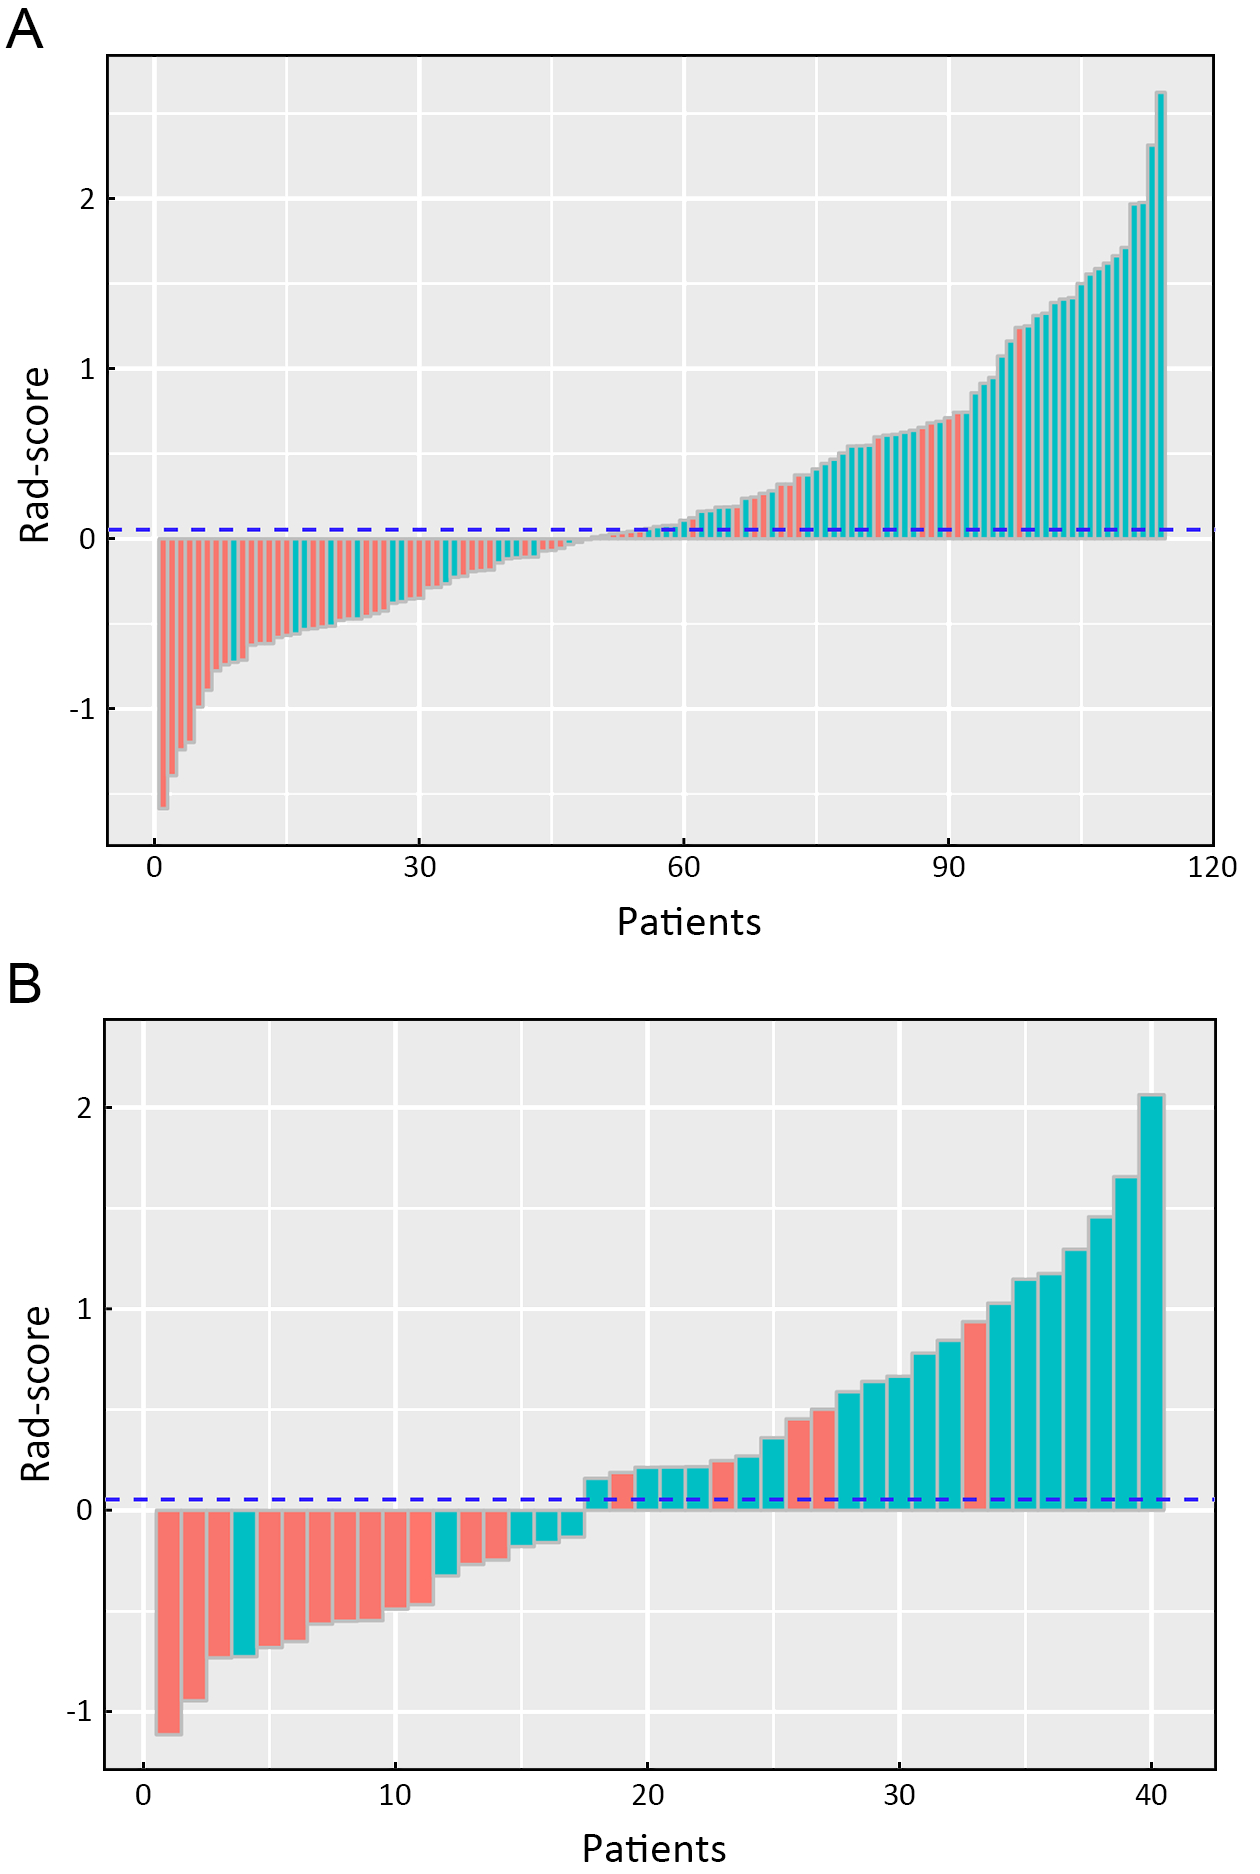
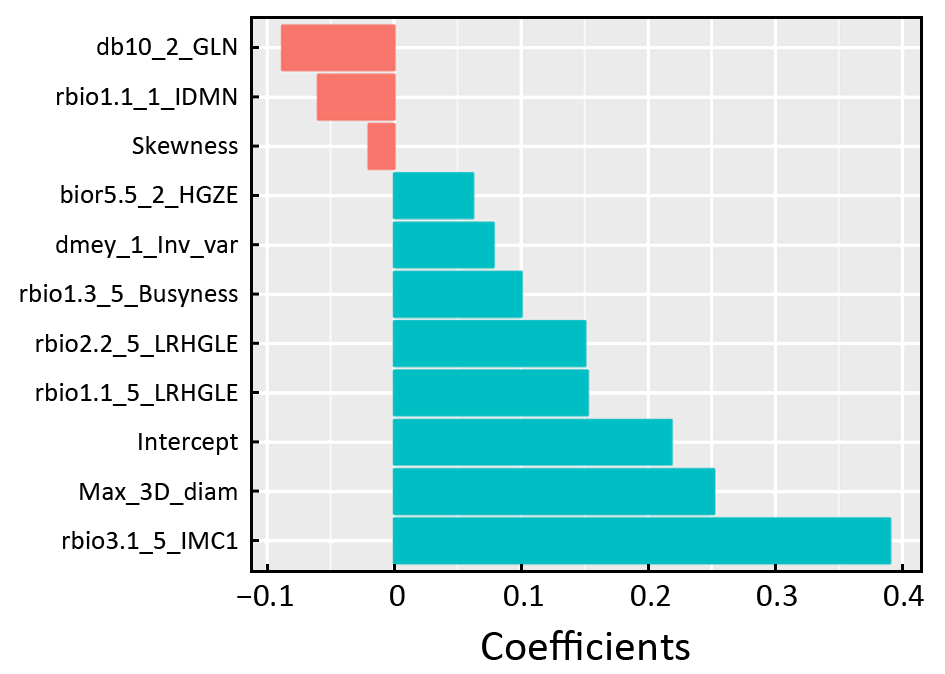
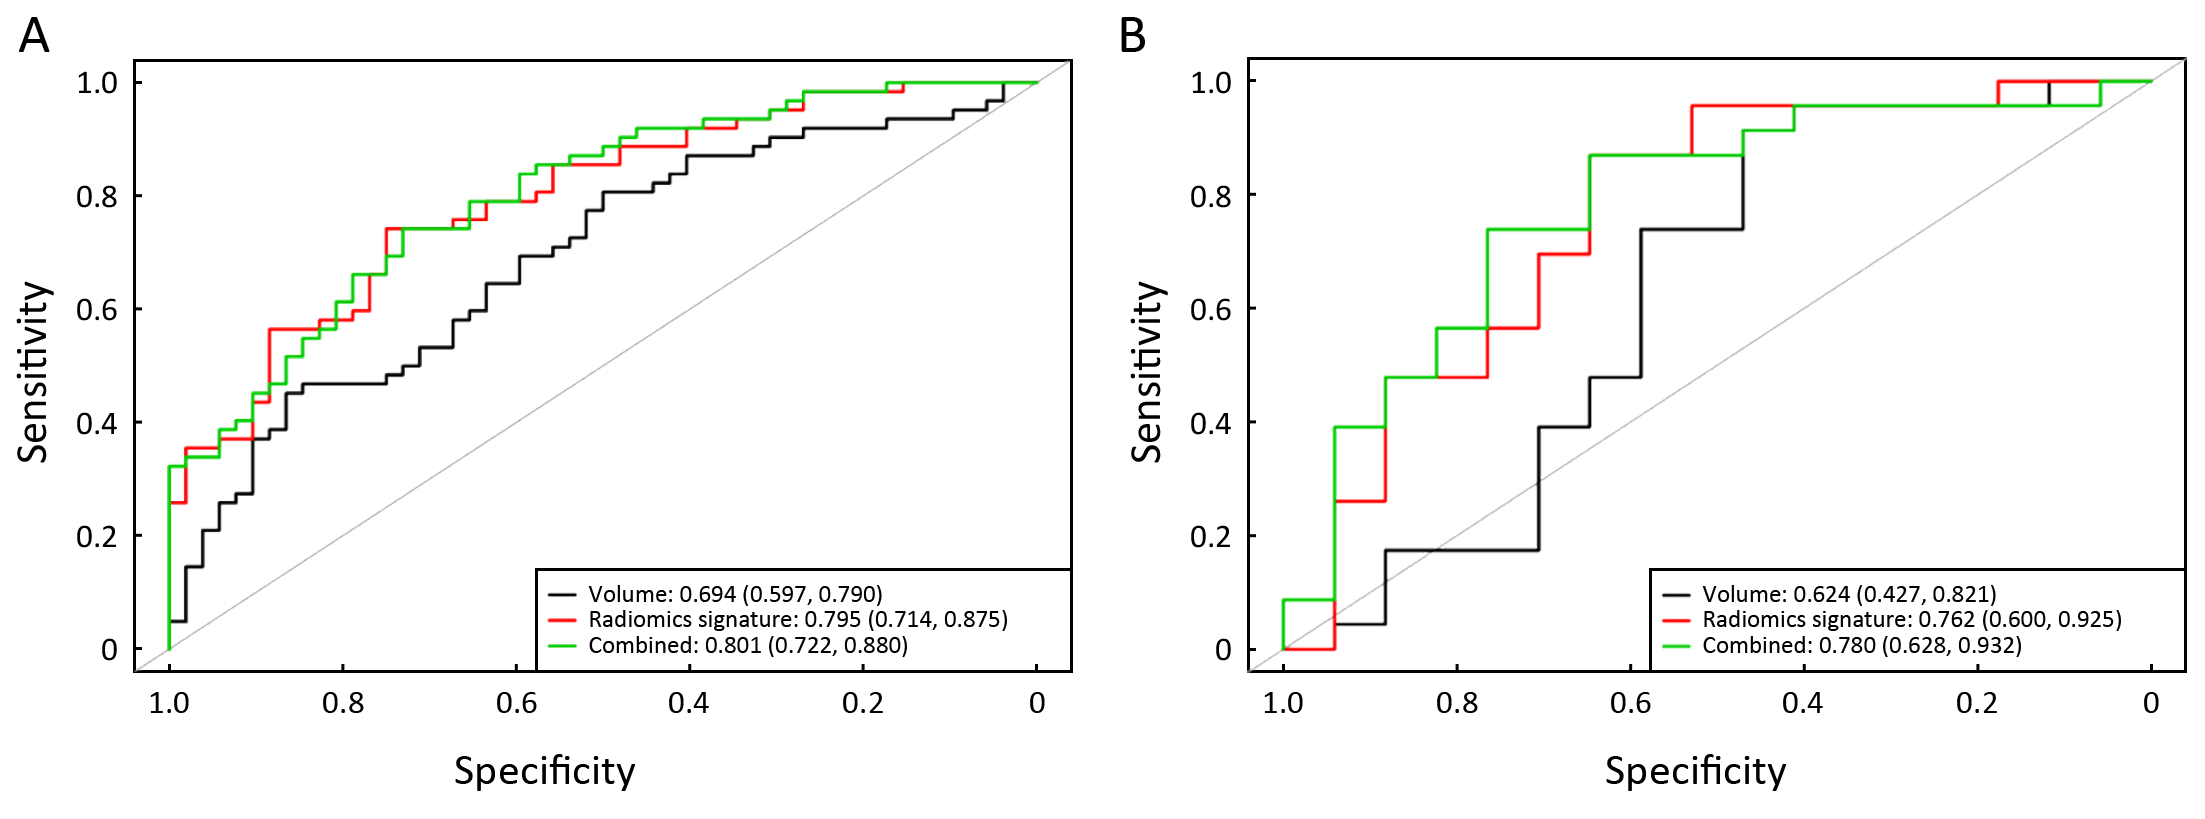
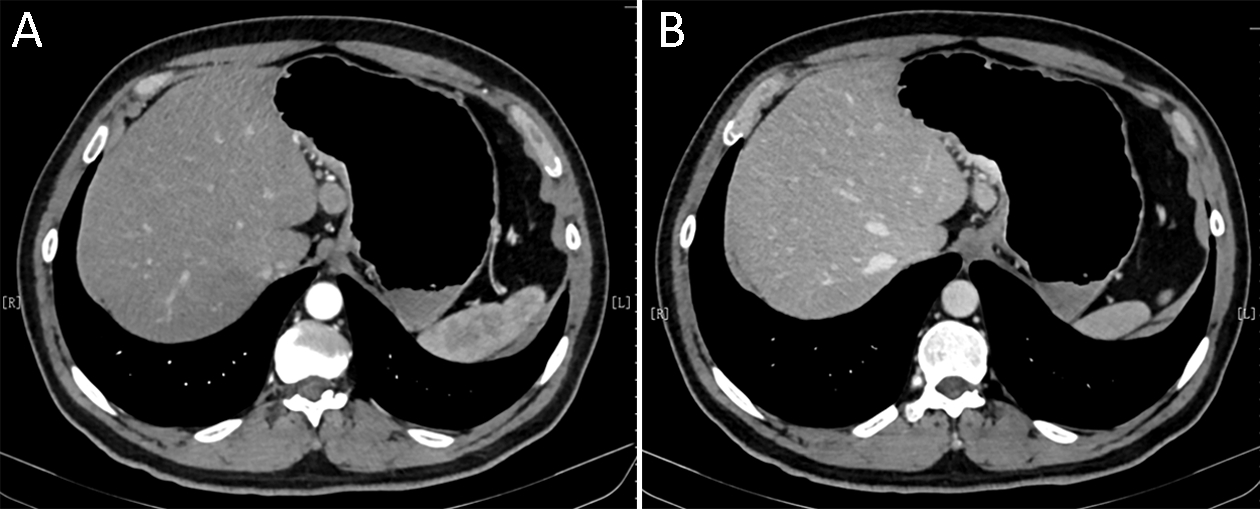
Objective To predict preoperative staging using a radiomics approach based on computed tomography (CT) images of patients with esophageal squamous cell carcinoma (ESCC). Methods This retrospective study included 154 patients (primary cohort: n=114; validation cohort: n=40) with pathologically confirmed ESCC. All patients underwent a preoperative CT scan from the neck to abdomen. High throughput and quantitative radiomics features were extracted from the CT images for each patient. A radiomics signature was constructed using the least absolute shrinkage and selection operator (Lasso). Associations between radiomics signature, tumor volume and ESCC staging were explored. Diagnostic performance of radiomics approach and tumor volume for discriminating between stages I−II and III−IV was evaluated and compared using the receiver operating characteristics (ROC) curves and net reclassification improvement (NRI). Results A total of 9,790 radiomics features were extracted. Ten features were selected to build a radiomics signature after feature dimension reduction. The radiomics signature was significantly associated with ESCC staging (P<0.001), and yielded a better performance for discrimination of early and advanced stage ESCC compared to tumor volume in both the primary [area under the receiver operating characteristic curve (AUC): 0.795 vs. 0.694, P=0.003; NRI=0.424)] and validation cohorts (AUC: 0.762 vs. 0.624, P=0.035; NRI=0.834). Conclusions The quantitative approach has the potential to identify stage I−II and III−IV ESCC before treatment.
2018, 30(4): 406-414.
doi: 10.21147/j.issn.1000-9604.2018.04.03
Abstract:
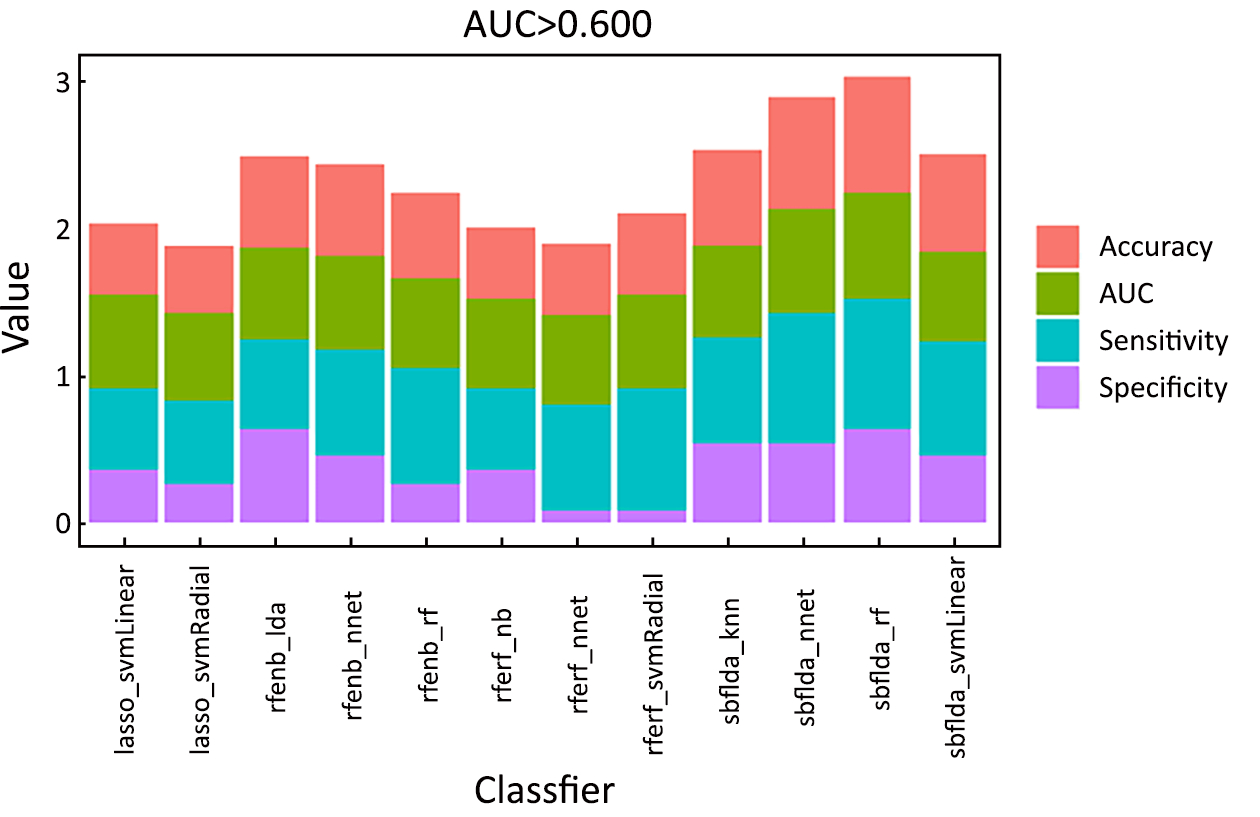
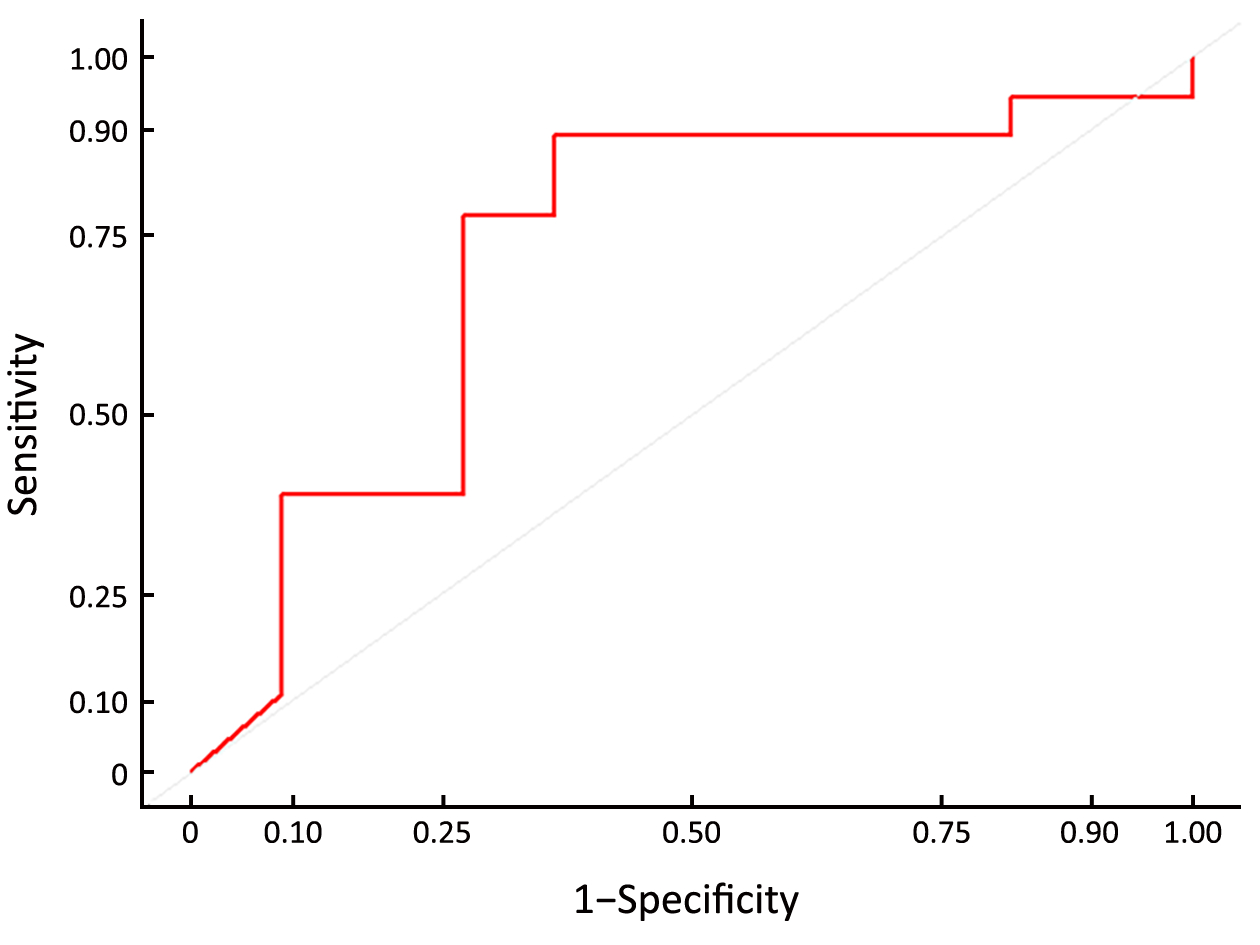
Objective The standard treatment for patients with locally advanced gastric cancer has relied on perioperative radio-chemotherapy or chemotherapy and surgery. The aim of this study was to investigate the wealth of radiomics for pre-treatment computed tomography (CT) in the prediction of the pathological response of locally advanced gastric cancer with preoperative chemotherapy. Methods Thirty consecutive patients with CT-staged II/III gastric cancer receiving neoadjuvant chemotherapy were enrolled in this study between December 2014 and March 2017. All patients underwent upper abdominal CT during the unenhanced, late arterial phase (AP) and portal venous phase (PP) before the administration of neoadjuvant chemotherapy. In total, 19,985 radiomics features were extracted in the AP and PP for each patient. Four methods were adopted during feature selection and eight methods were used in the process of building the classifier model. Thirty-two combinations of feature selection and classification methods were examined. Receiver operating characteristic (ROC) curves were used to evaluate the capability of each combination of feature selection and classification method to predict a non-good response (non-GR) based on tumor regression grade (TRG). Results The mean area under the curve (AUC) ranged from 0.194 to 0.621 in the AP, and from 0.455 to 0.722 in the PP, according to different combinations of feature selection and the classification methods. There was only one cross-combination machine-learning method indicating a relatively higher AUC (>0.600) in the AP, while 12 cross-combination machine-learning methods presented relatively higher AUCs (all >0.600) in the PP. The feature selection method adopted by a filter based on linear discriminant analysis + classifier of random forest achieved a significantly prognostic performance in the PP (AUC, 0.722±0.108; accuracy, 0.793; sensitivity, 0.636; specificity, 0.889; Z=2.039; P=0.041). Conclusions It is possible to predict non-GR after neoadjuvant chemotherapy in locally advanced gastric cancers based on the radiomics of CT.

2018, 30(4): 415-424.
doi: 10.21147/j.issn.1000-9604.2018.04.04
Abstract:
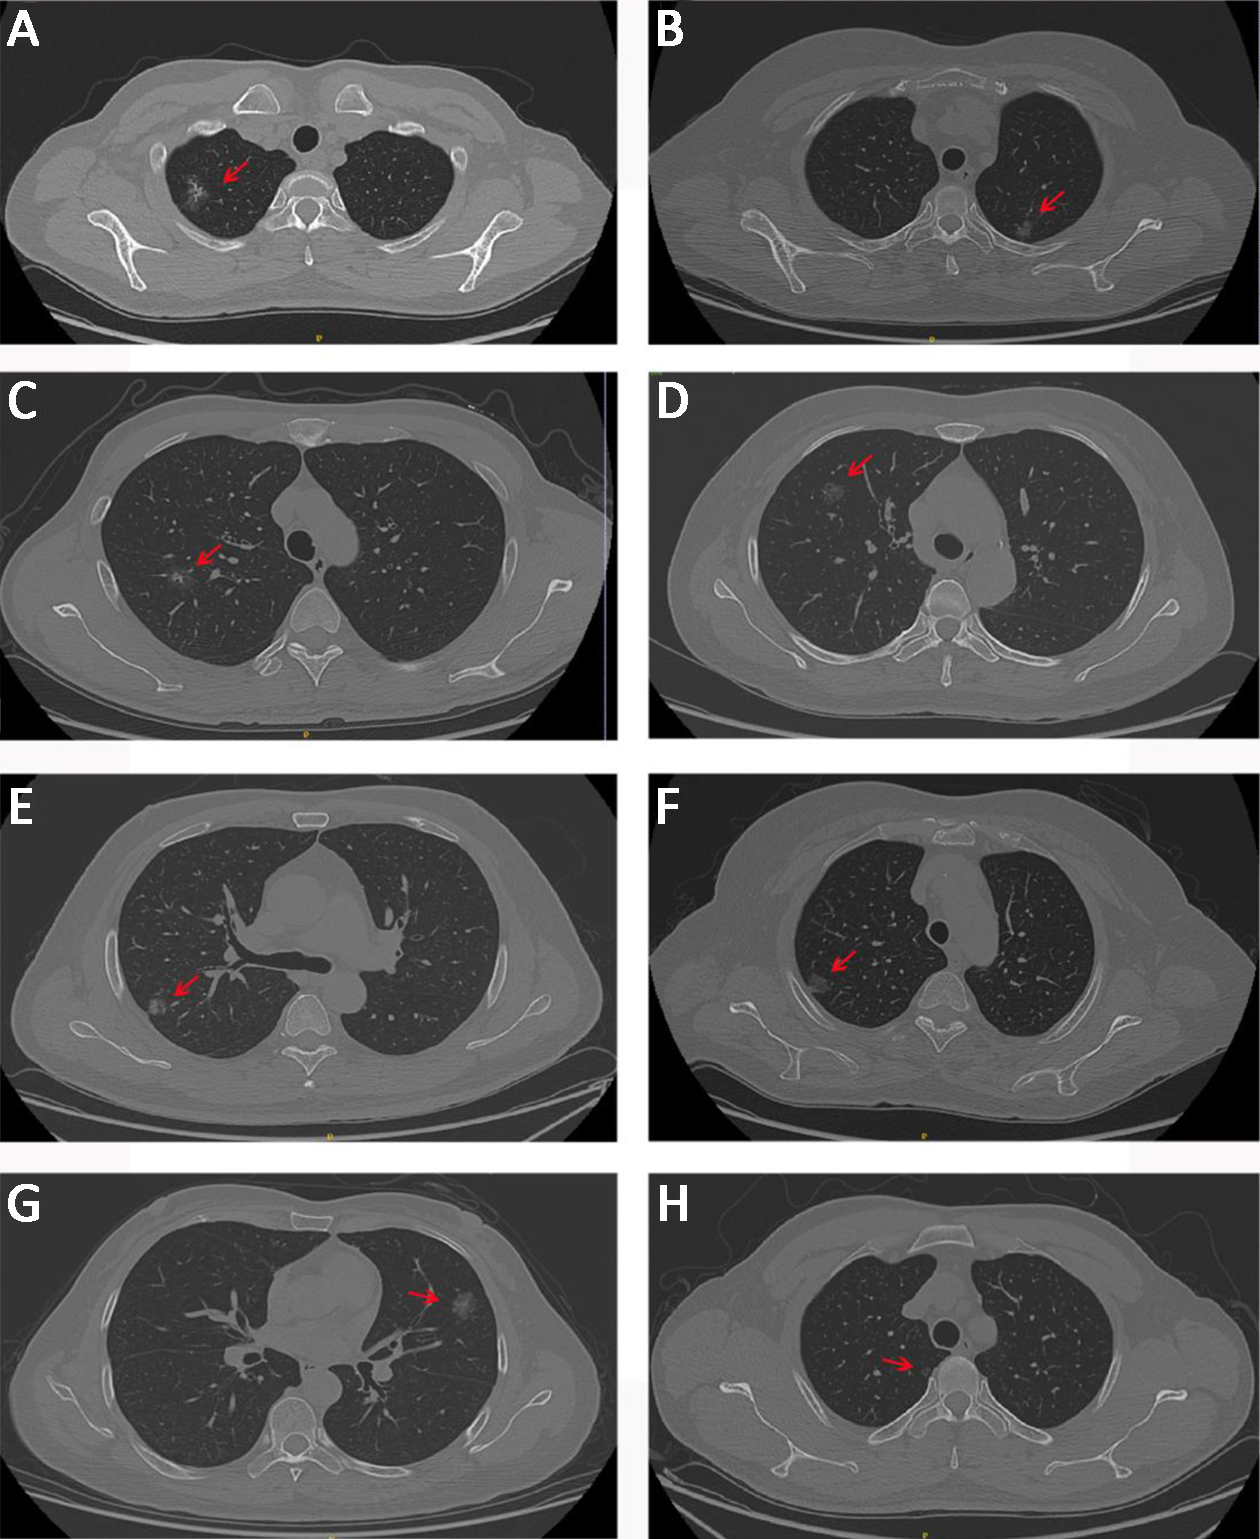
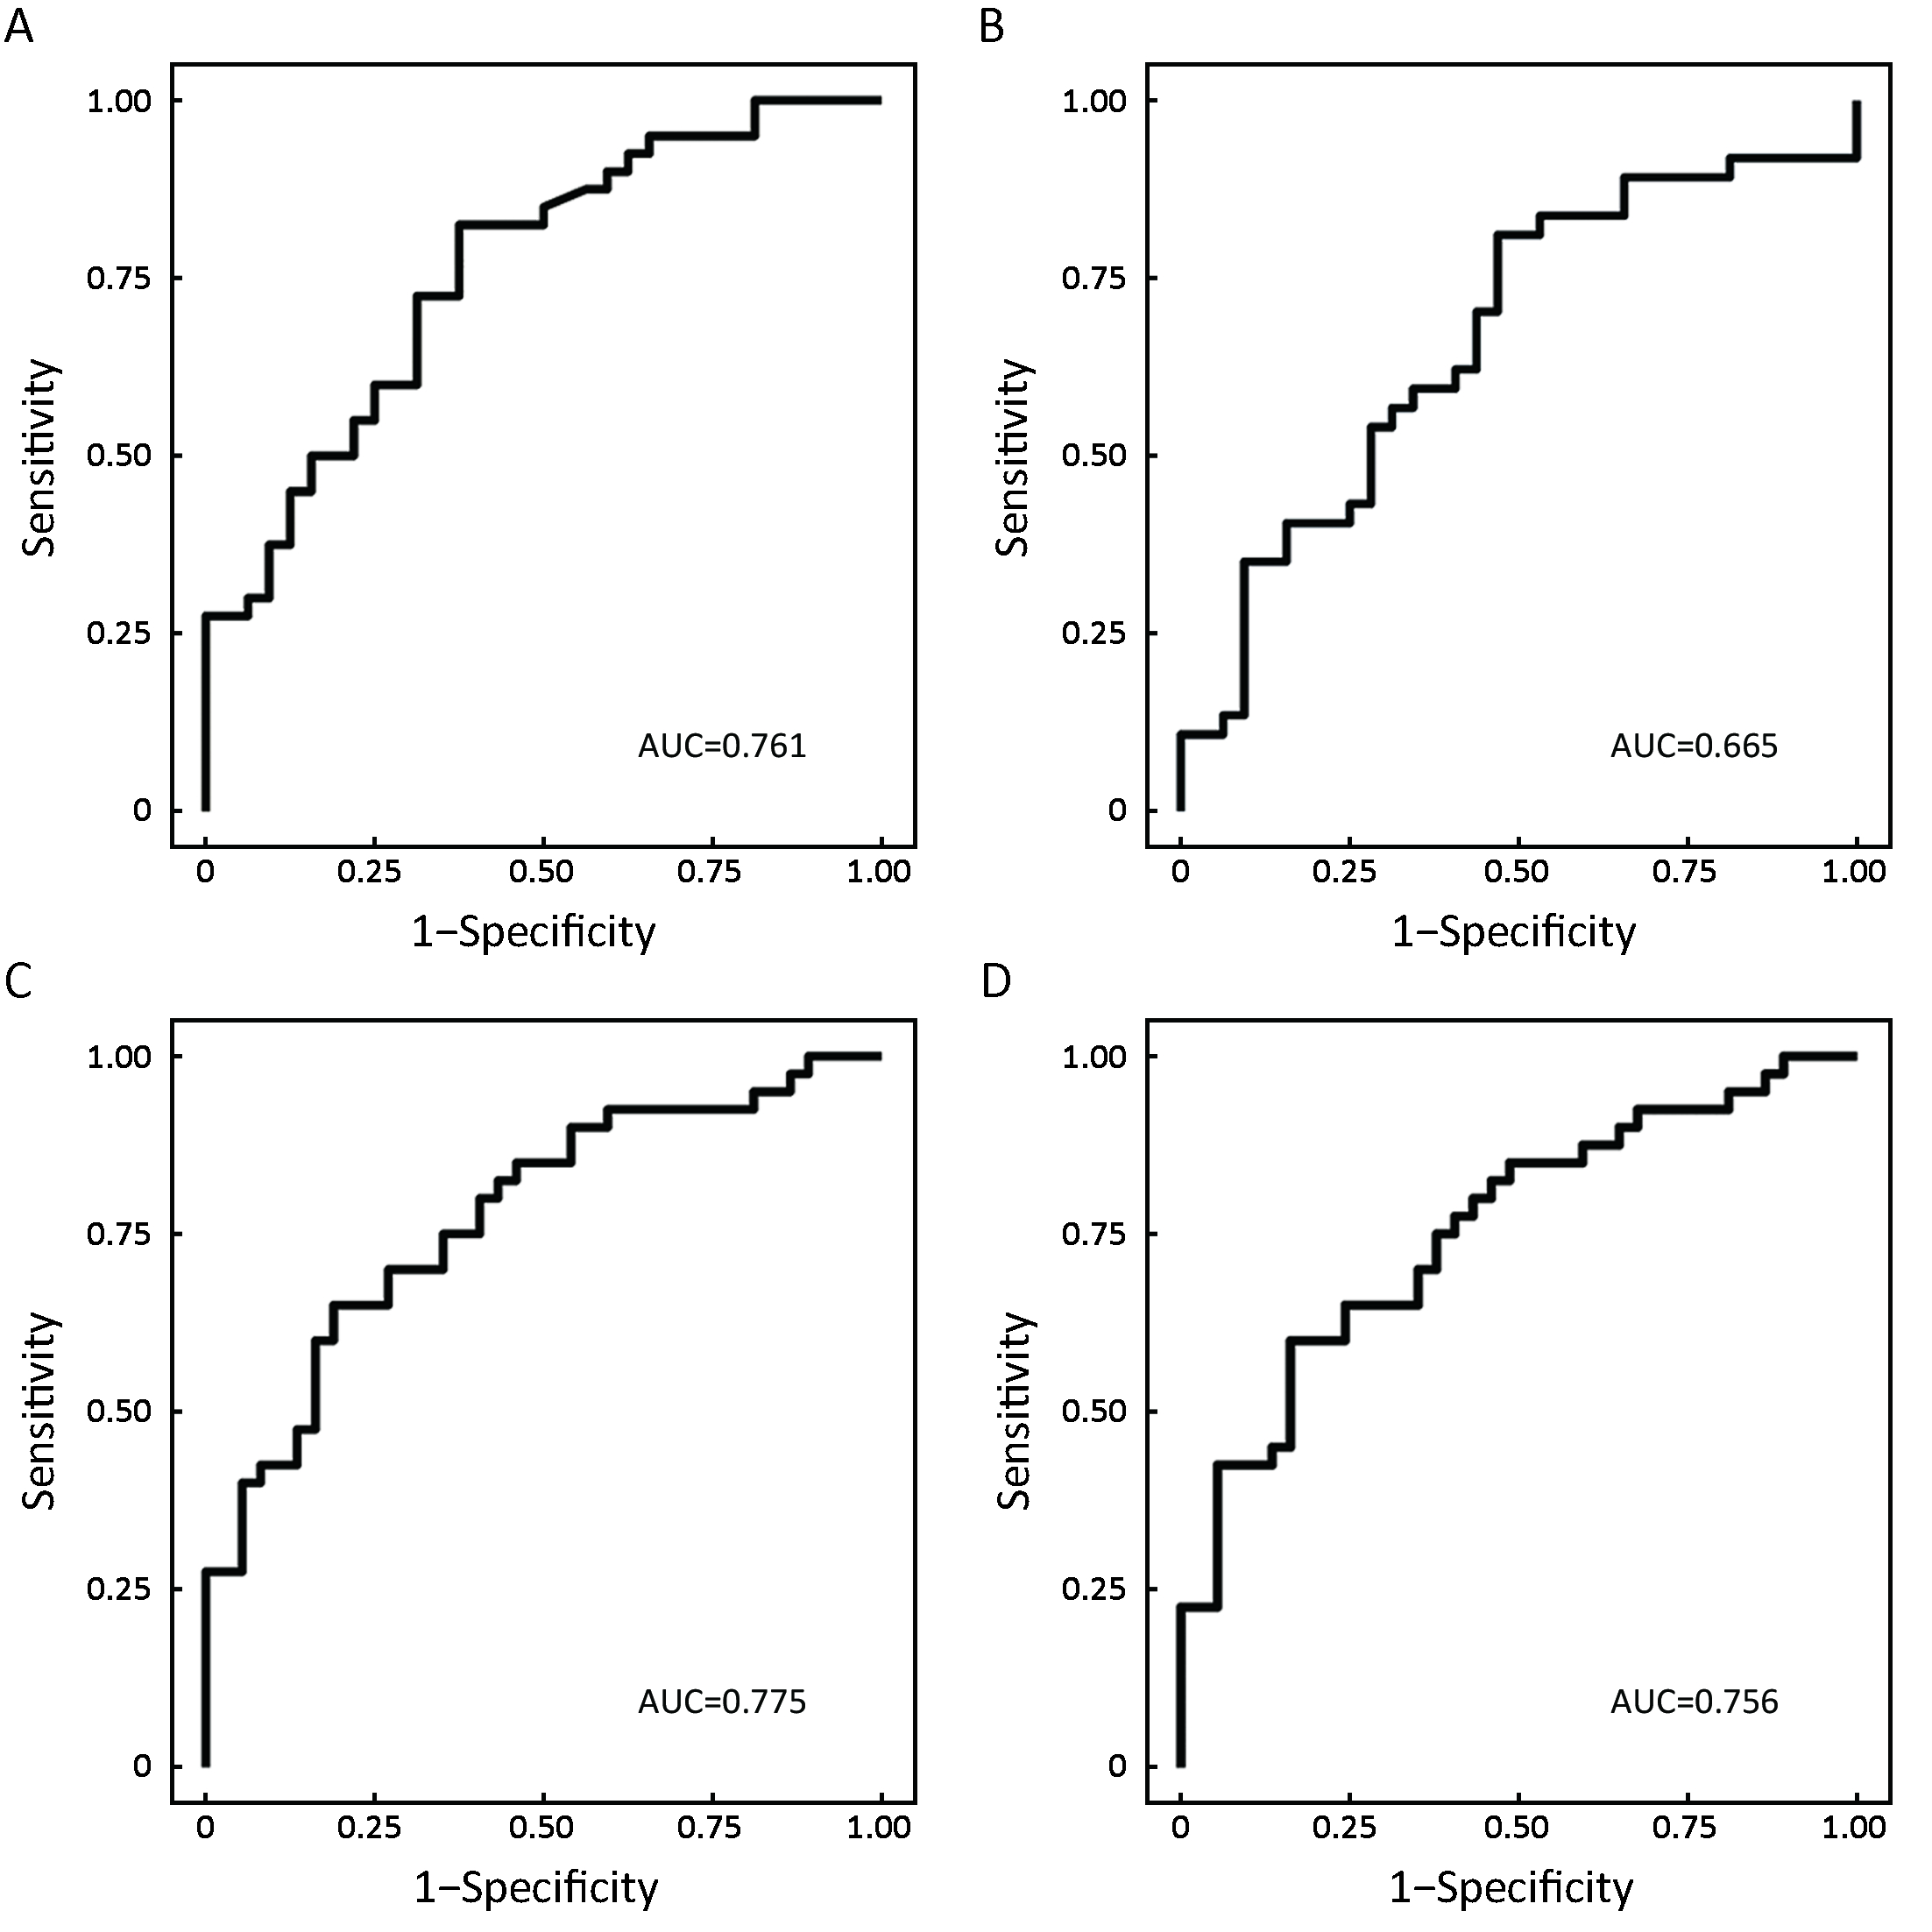
Objective To identify the differences among preinvasive lesions, minimally invasive adenocarcinomas (MIAs) and invasive pulmonary adenocarcinomas (IPAs) based on radiomic feature analysis with computed tomography (CT). Methods A total of 109 patients with ground-glass opacity lesions (GGOs) in the lungs determined by CT examinations were enrolled, all of whom had received a pathologic diagnosis. After the manual delineation and segmentation of the GGOs as regions of interest (ROIs), the patients were subdivided into three groups based on pathologic analyses: the preinvasive lesions (including atypical adenomatous hyperplasia and adenocarcinoma in situ) subgroup, the MIA subgroup and the IPA subgroup. Next, we obtained the texture features of the GGOs. The data analysis was aimed at finding both the differences between each pair of the groups and predictors to distinguish any two pathologic subtypes using logistic regression. Finally, a receiver operating characteristic (ROC) curve was applied to accurately evaluate the performances of the regression models. Results We found that the voxel count feature (P<0.001) could be used as a predictor for distinguishing IPAs from preinvasive lesions. However, the surface area feature (P=0.040) and the extruded surface area feature (P=0.013) could be predictors of IPAs compared with MIAs. In addition, the correlation feature (P=0.046) could distinguish preinvasive lesions from MIAs better. Conclusions Preinvasive lesions, MIAs and IPAs can be discriminated based on texture features within CT images, although the three diseases could all appear as GGOs on CT images. The diagnoses of these three diseases are very important for clinical surgery.
2018, 30(4): 425-431.
doi: 10.21147/j.issn.1000-9604.2018.04.05
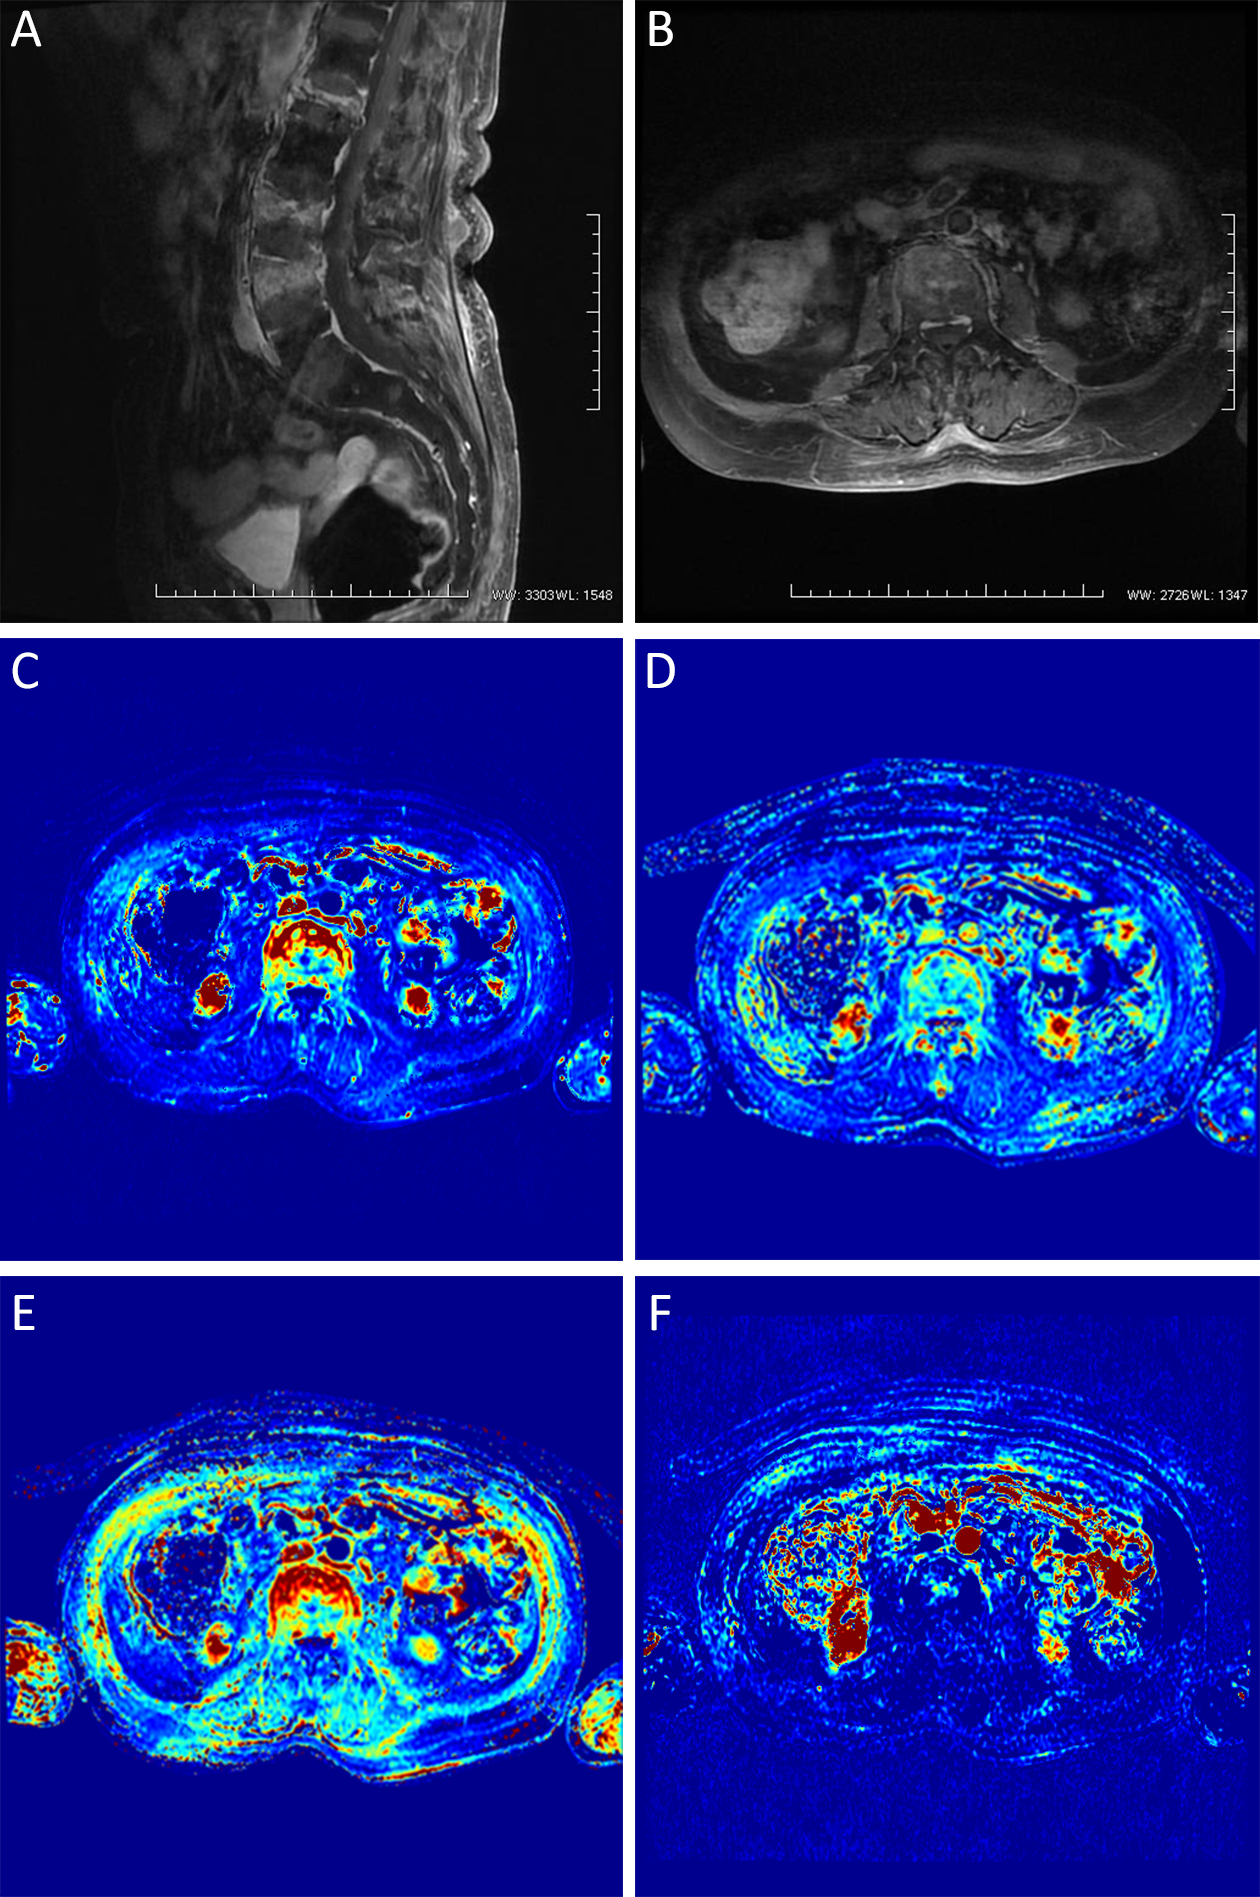
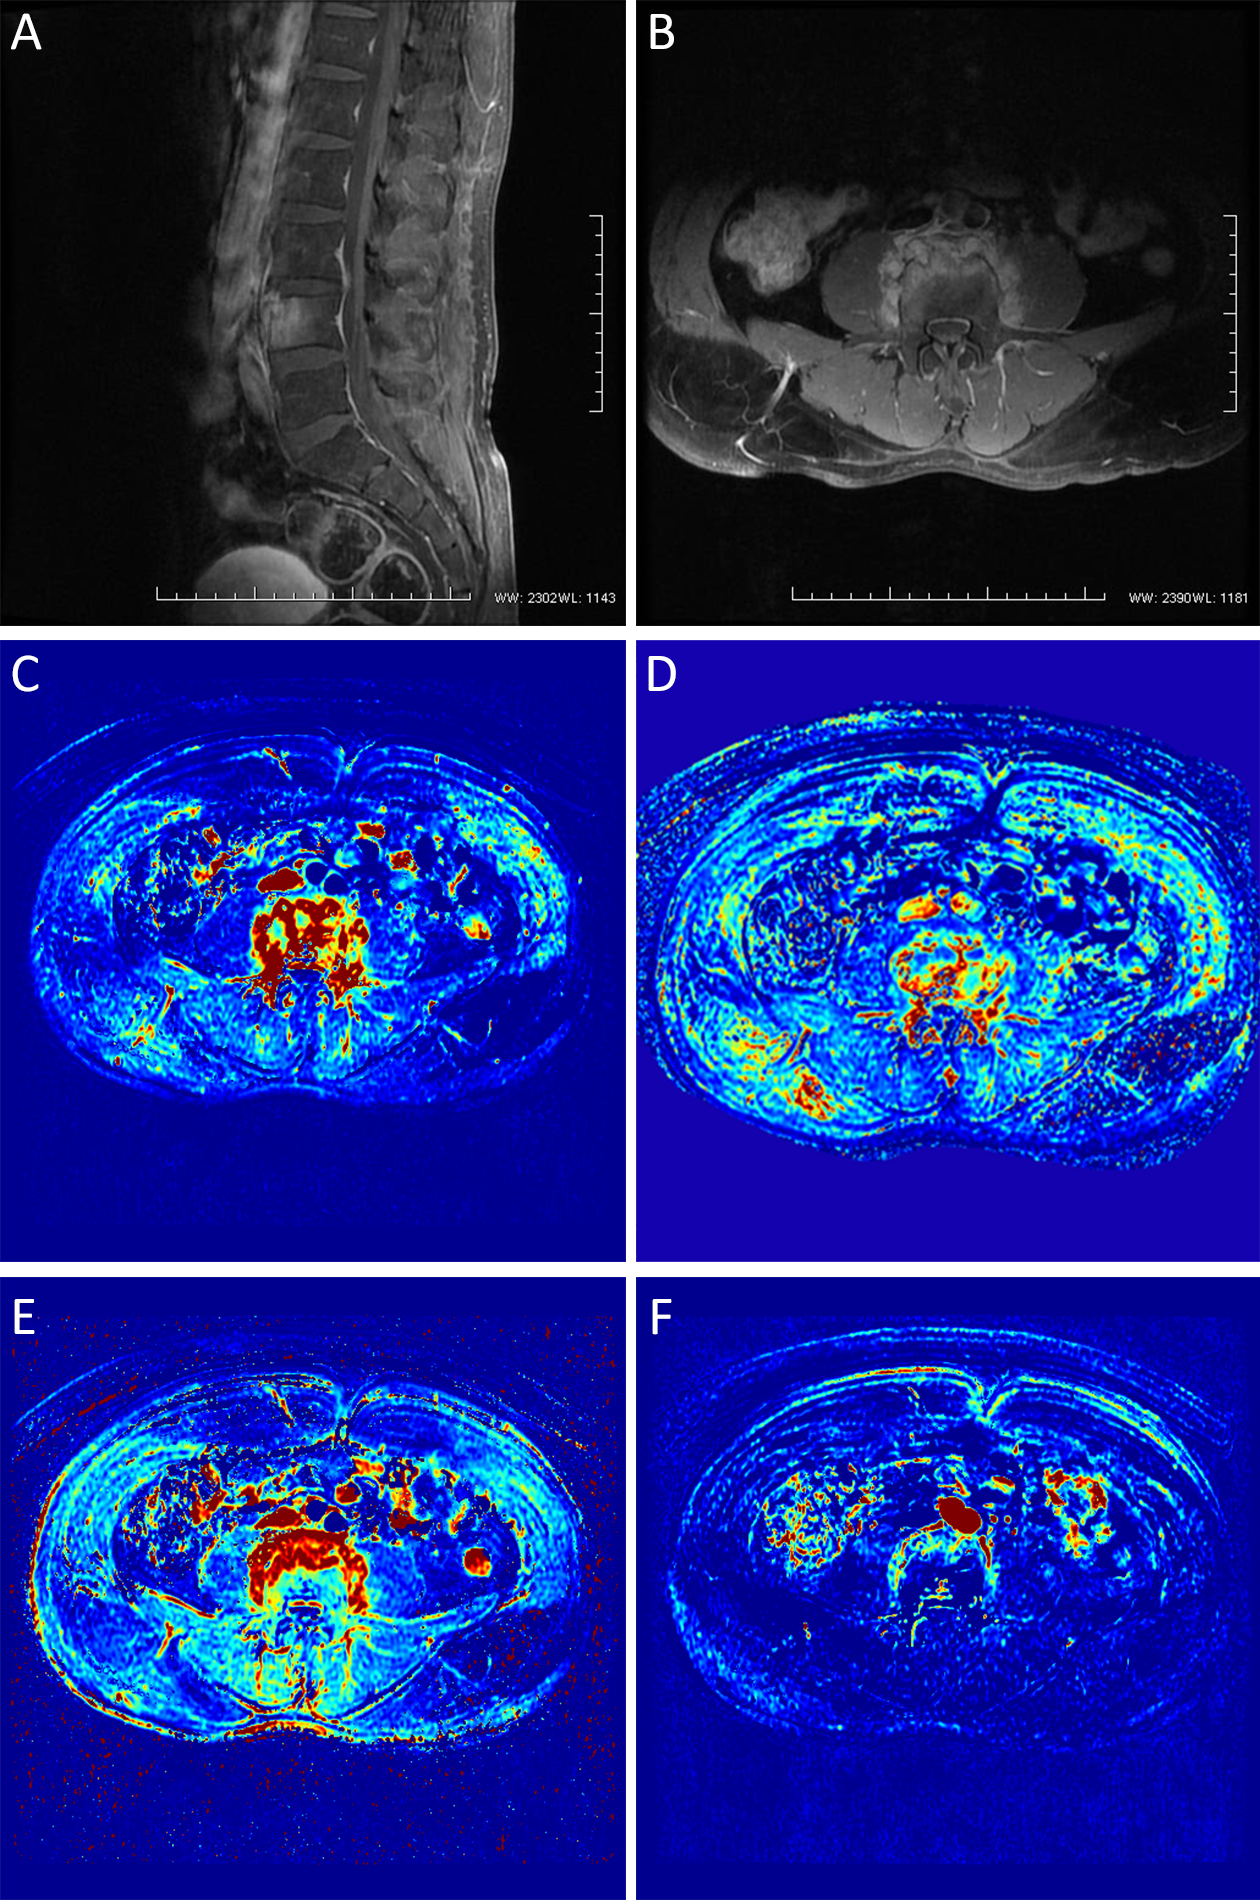
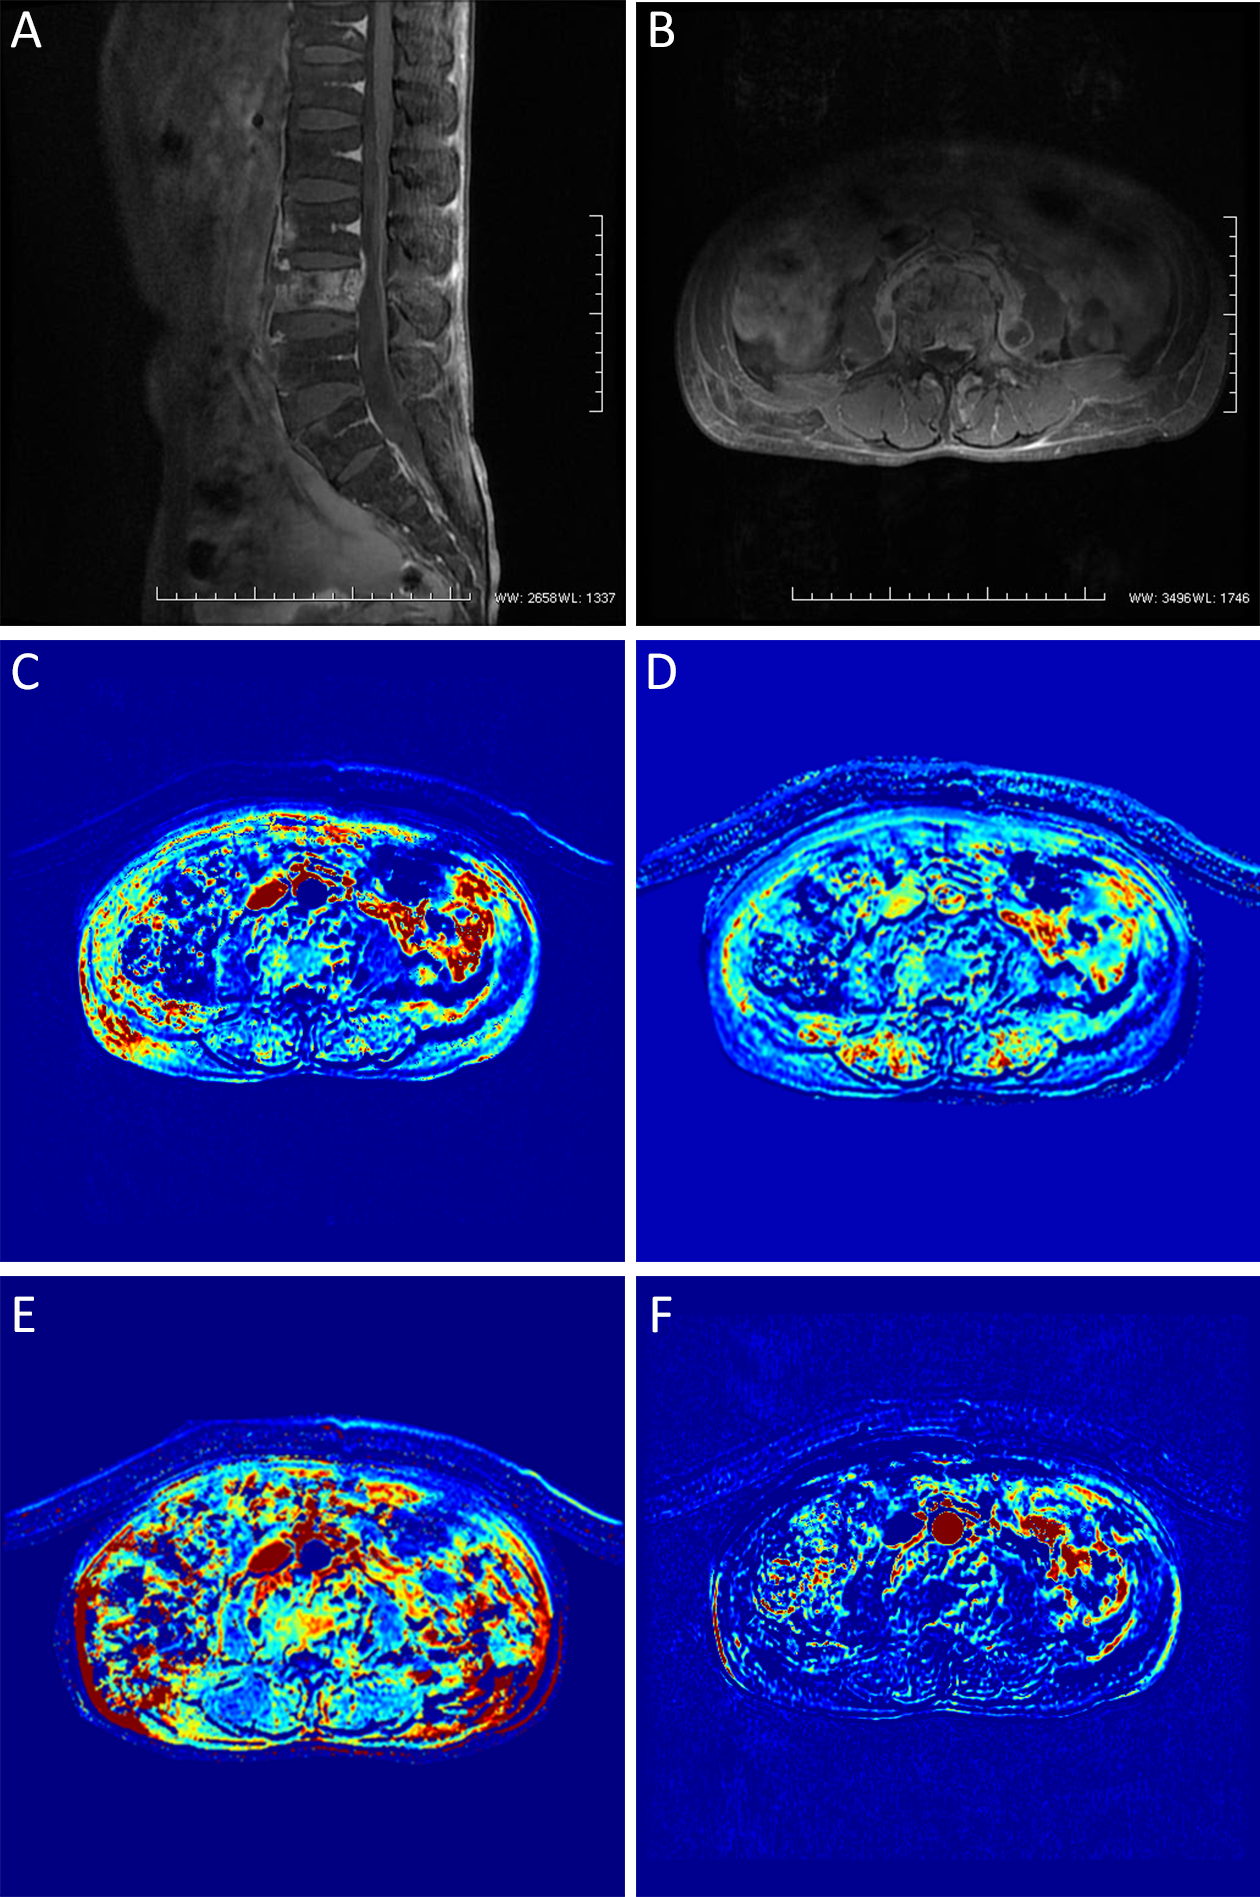
Abstract:
Objective In the present study, spinal metastatic tumors, brucellar spondylitis and spinal tuberculosis were quantitatively analyzed using dynamic contrast-enhanced magnetic resonance imaging (DCE-MRI) to assess the value of DCE-MRI in the differential diagnosis of these diseases. Methods Patients with brucellar spondylitis, spinal tuberculosis or a spinal metastatic tumor (30 cases of each) received conventional MRI and DCE-MRI examination. The volume transfer constant (Ktrans), rate constant (Kep), extravascular extracellular volume fraction (Ve) and plasma volume fraction (Vp) of the diseased vertebral bodies were measured on the perfusion parameter map, and the differences in these parameters between the patients were compared. Results For pathological vertebrae in cases of spinal metastatic tumor, brucellar spondylitis and spinal tuberculosis, respectively, the Ktrans values (median ± quartile pitch) were 0.989±0.014, 0.720±0.011 and 0.317±0.005 min–1; the Kep values were 2.898±0.055, 1.327±0.017 and 0.748±0.006 min–1; the Ve values were 0.339±0.008, 0.542±0.013 and 0.428±0.018; the Vp values were 0.048±0.008, 0.035±0.004 and 0.028±0.009; the corresponding H values were 50.25 (for Ktrans), 52.47 (for Kep), 48.33 (for Ve) and 46.56 (for Vp), and all differences were statistically significant (two-sided P<0.05). Conclusions The quantitative analysis of DCE-MRI has a certain value in the differential diagnosis of spinal metastatic tumor, brucellar spondylitis and spinal tuberculosis.
2018, 30(4): 432-438.
doi: 10.21147/j.issn.1000-9604.2018.04.06
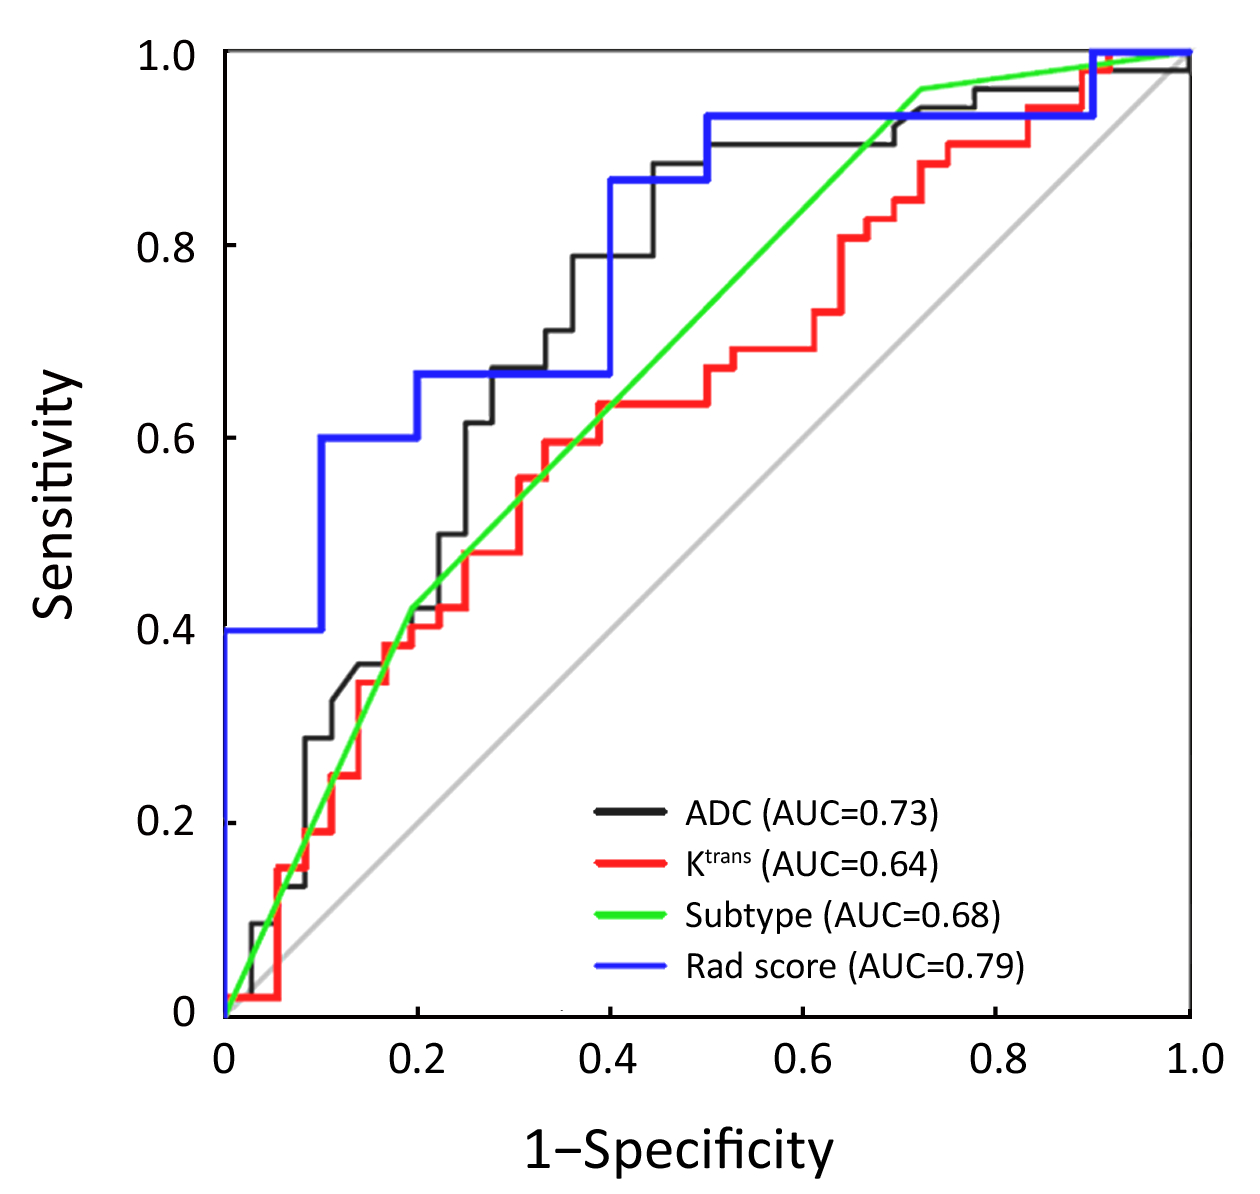
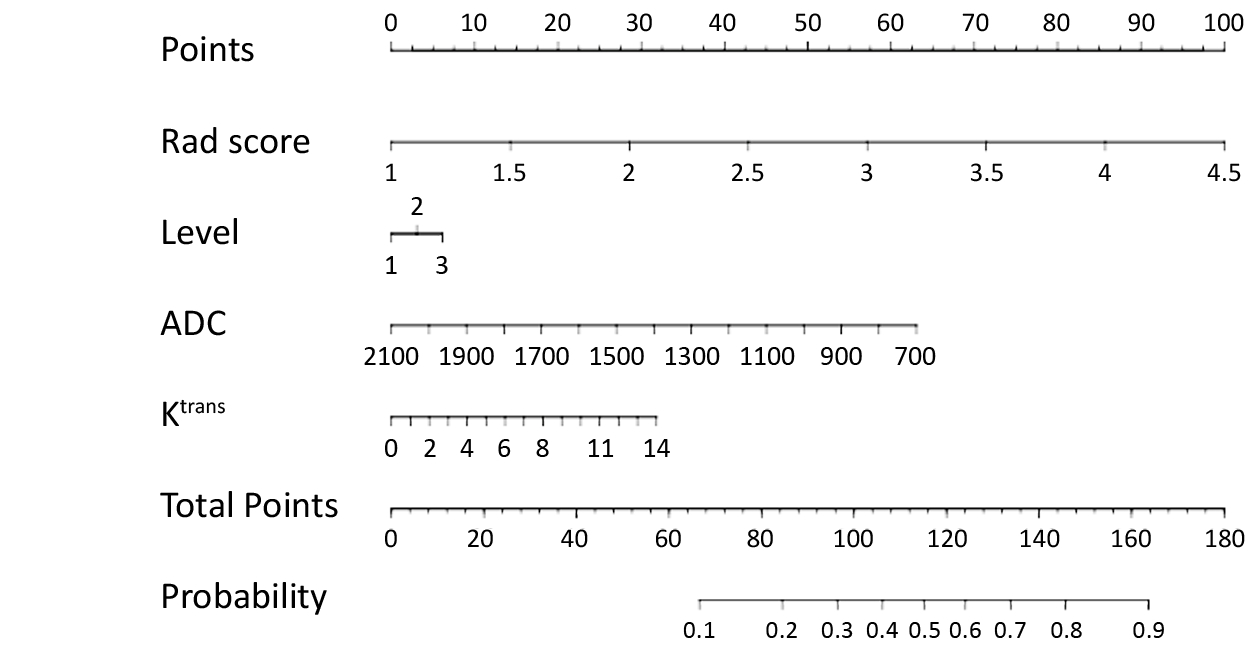
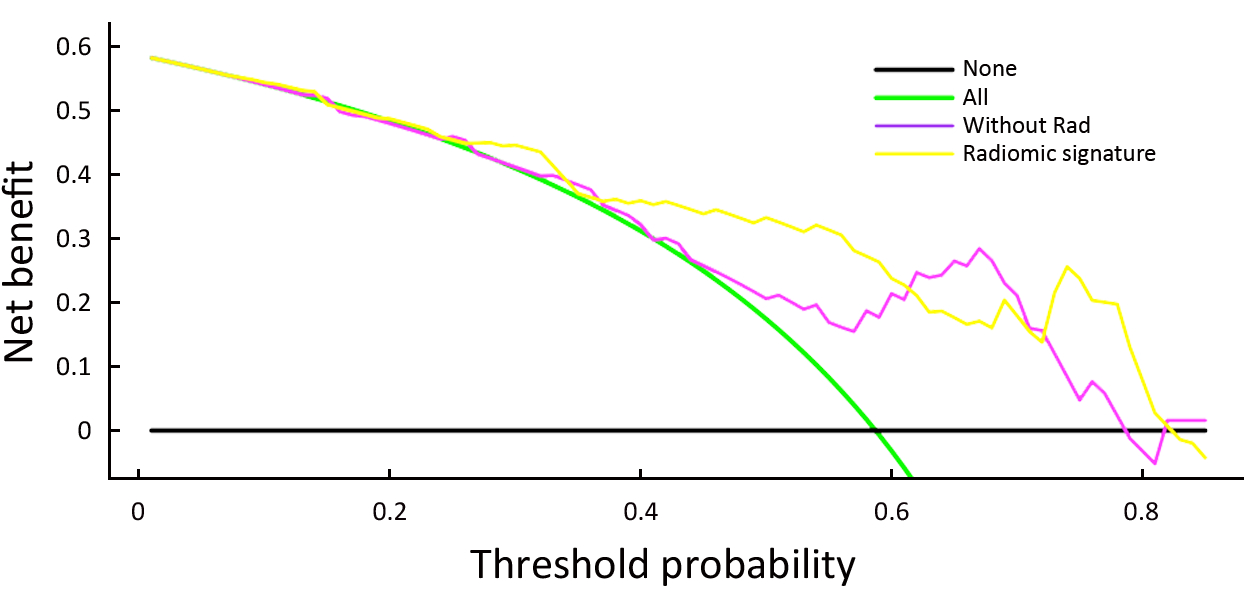
Abstract:
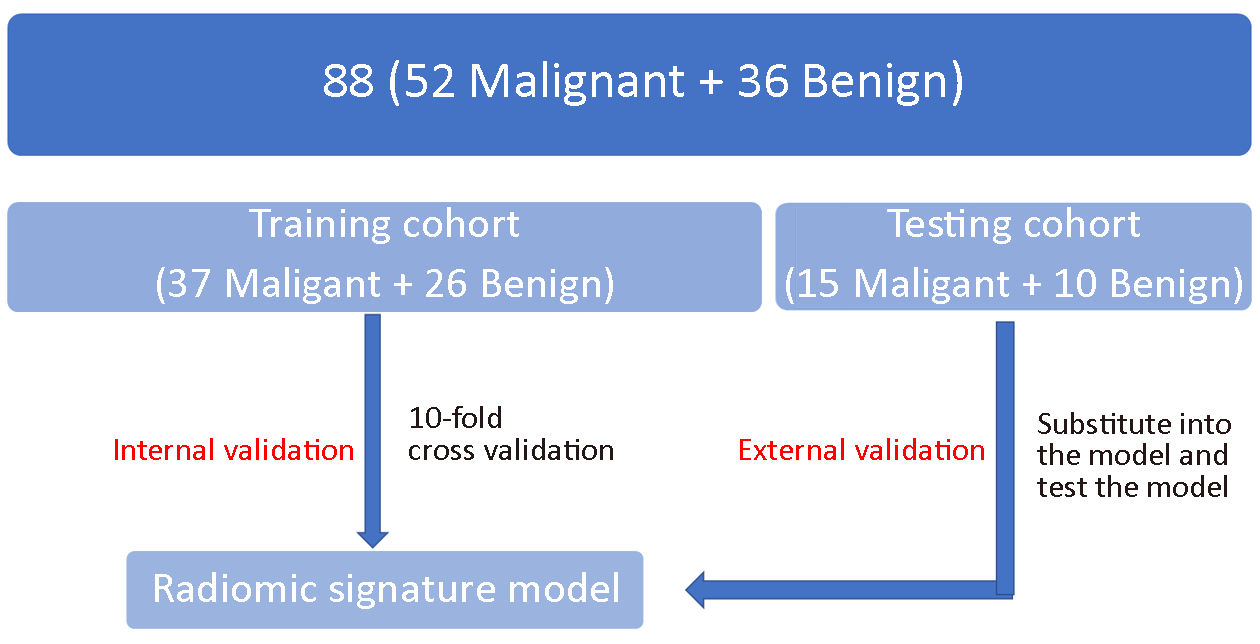
Objective To develop and validate a radiomic nomogram based on an apparent diffusion coefficient (ADC) map for differentiating benign and malignant lesions in suspicious breast findings classified as Breast Imaging Reporting and Data System (BI-RADS) category 4 on breast magnetic resonance imaging (MRI). Methods Eighty-eight patients diagnosed with BI-RADS 4 findings on breast MRI in the First Affiliated Hospital of China Medical University from December 2014 to December 2015 were retrospectively analyzed in this study. Sixty-three were randomized electronically to establish forecasting models, and the other 25 were used for validation. Radiomic features based on the ADC map were generated automatically by Artificial Intelligence Kit software (A.K. software; GE Healthcare, China). Feature reduction was conducted using the Mann-Whitney test and Spearman correlation after pre-treatment. A prediction model of ADC radiomics was established by logistic linear regression and cross-validation. A nomogram was established based on ADC radiomic features, pharmacokinetics and clinical features, including the morphology and ADC value for breast BI-RADS 4 lesions on MRI. Results A total of 396 radiomic features were extracted automatically by the A.K. software. Five features were selected after pre-processing, Mann-Whitney tests and Spearman correlation analysis. The area under the ROC curve of the prediction model comprising ADC radiomic features was 0.79 when the cutoff value was 0.45, and the accuracy, sensitivity and specificity were 80.0%, 0.813 and 0.778, respectively. A visualized differential nomogram based on the radiomic score, pharmacokinetics and clinical features was established. The decision curve showed good consistency. Conclusions ADC radiomic features could provide an important reference for differential diagnosis between benign and malignant lesions in suspicious BI-RADS 4 lesions. The visualized nomogram based on ADC radiomic features, pharmacokinetics and clinical features may have good prospects for clinical application.
2018, 30(4): 439-448.
doi: 10.21147/j.issn.1000-9604.2018.04.07
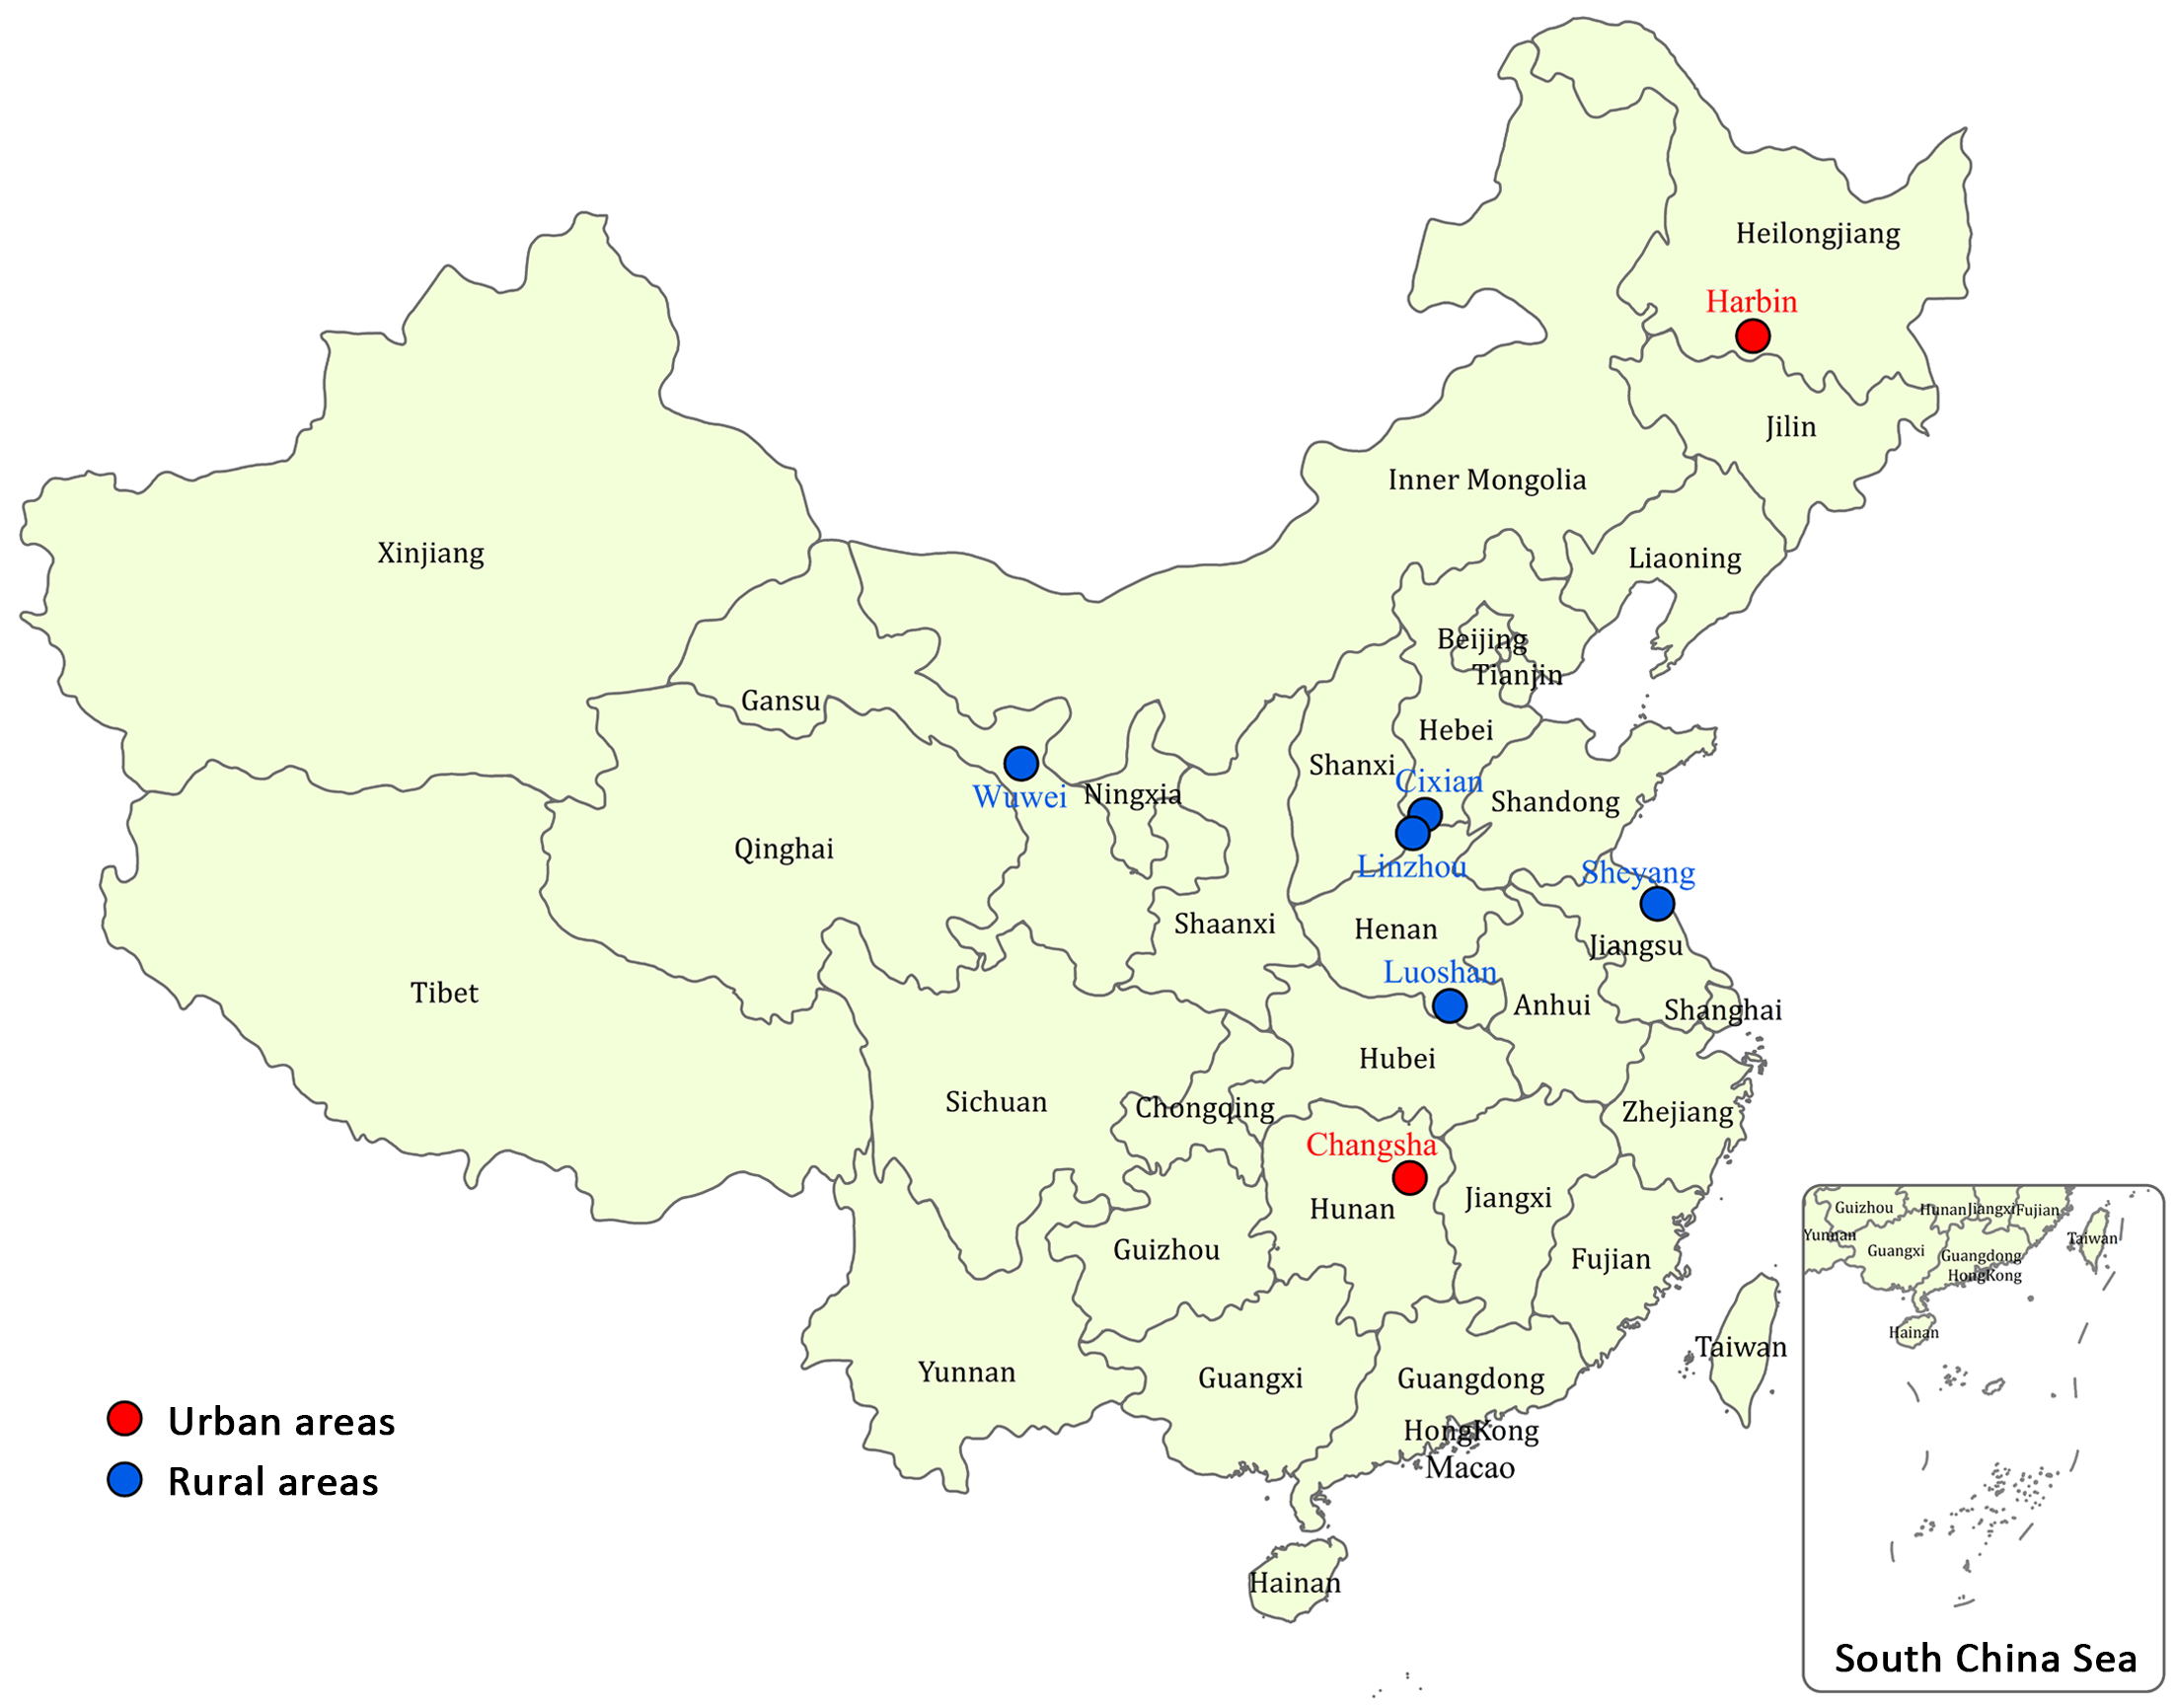
Abstract:
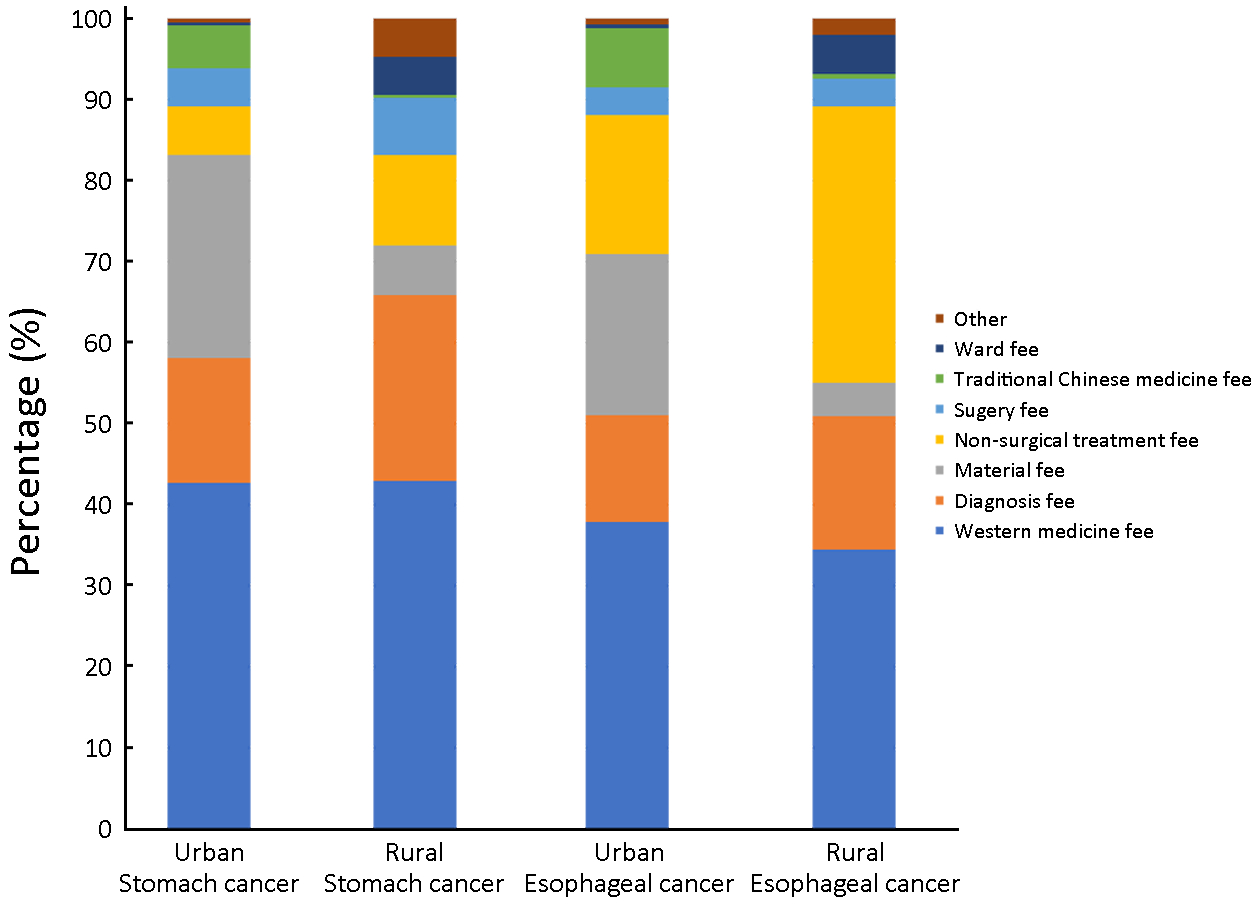
Objective Stomach and esophageal cancer are imposing huge threats to the health of Chinese people whereas there were few studies on the financial burden of the two cancers. Methods Costs per hospitalization of all patients with stomach or esophageal cancer discharged between September 2015 and August 2016 in seven cities/counties in China were collected, together with their demographic information and clinical details. Former patients in the same hospitals were sampled to collect information on annual direct non-medical cost, indirect costs and annual number of hospitalization. Annual direct medical cost was obtained by multiplying cost per hospitalization by annual number of hospitalization. Annual cost of illness (ACI) was obtained by adding the average value of annual direct medical cost, direct non-medical cost and indirect cost, stratified by sex, age, clinical stage, therapy and pathologic type in urban and rural areas. Costs per hospitalization were itemized into eight parts to calculate the proportion of each part. All costs were converted to 2016 US dollars (1 USD=6.6423 RMB). Results Totally 19,986 cases were included, predominately male. Mean ages of stomach cancer and urban patients were lower than that of esophageal cancer and rural patients. ACI of stomach and esophageal cancer patients were $10,449 and $13,029 in urban areas, and $2,927 and $3,504 in rural areas, respectively. Greater ACI was associated with male, non-elderly patients as well as those who were in stage I and underwent surgeries. Western medicine fee took the largest proportion of cost per hospitalization. Conclusions The ACI of stomach and esophageal cancer was tremendous and varied substantially among the population in China. Preferential policies of medical insurance should be designed to tackle with this burden and further reduce the health care inequalities.
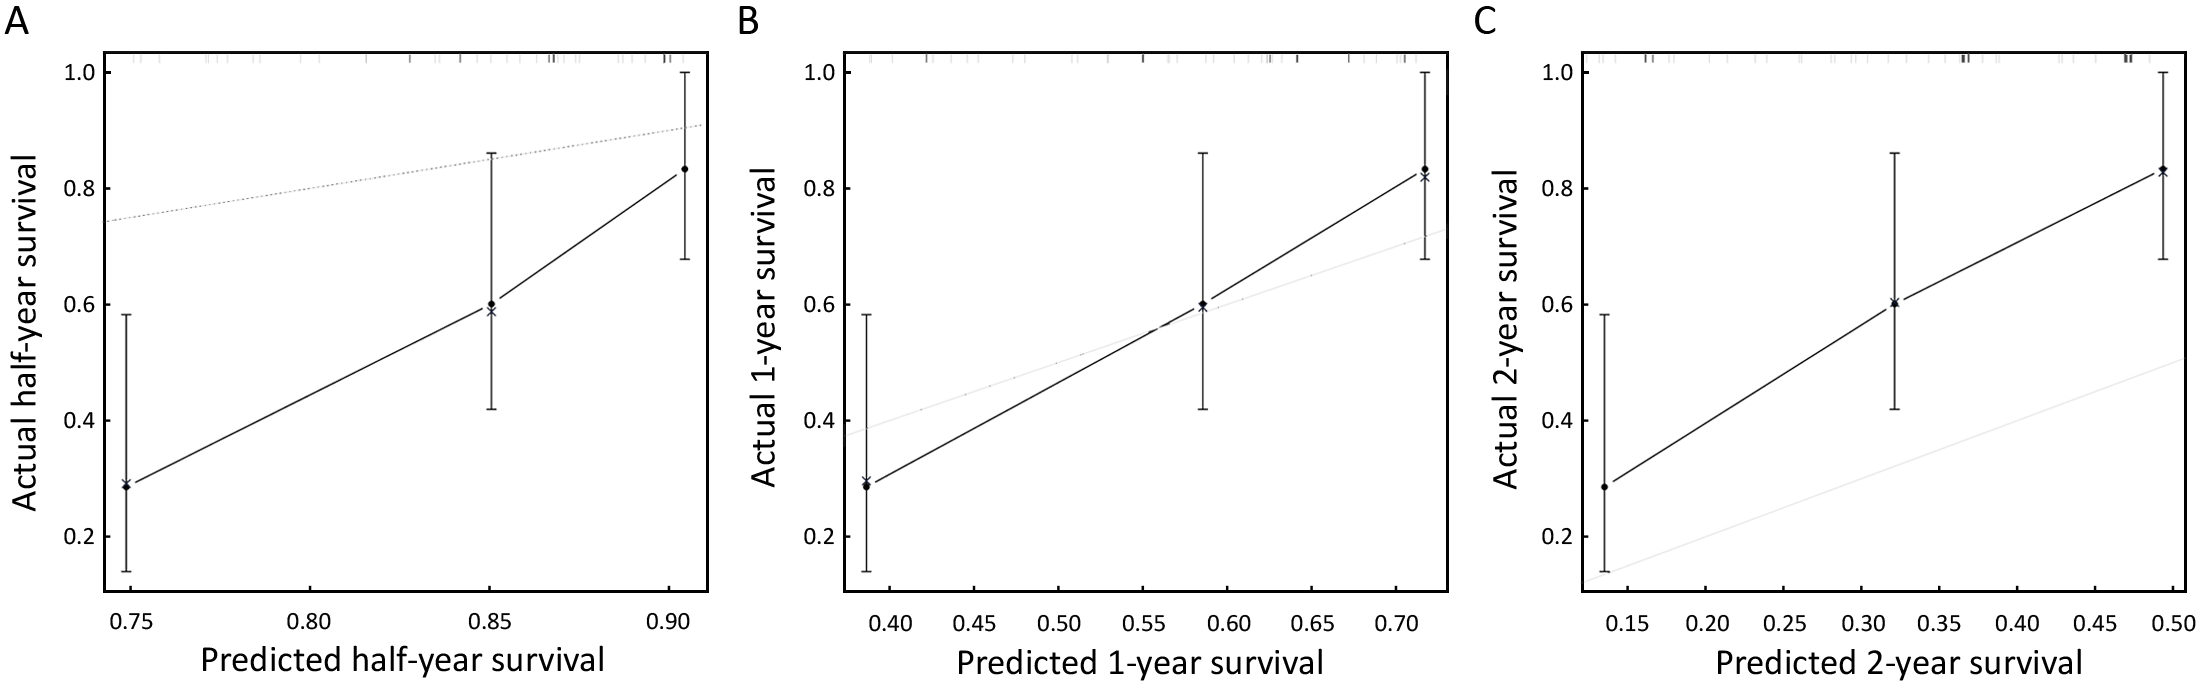
2018, 30(4): 449-459.
doi: 10.21147/j.issn.1000-9604.2018.04.08
Abstract:
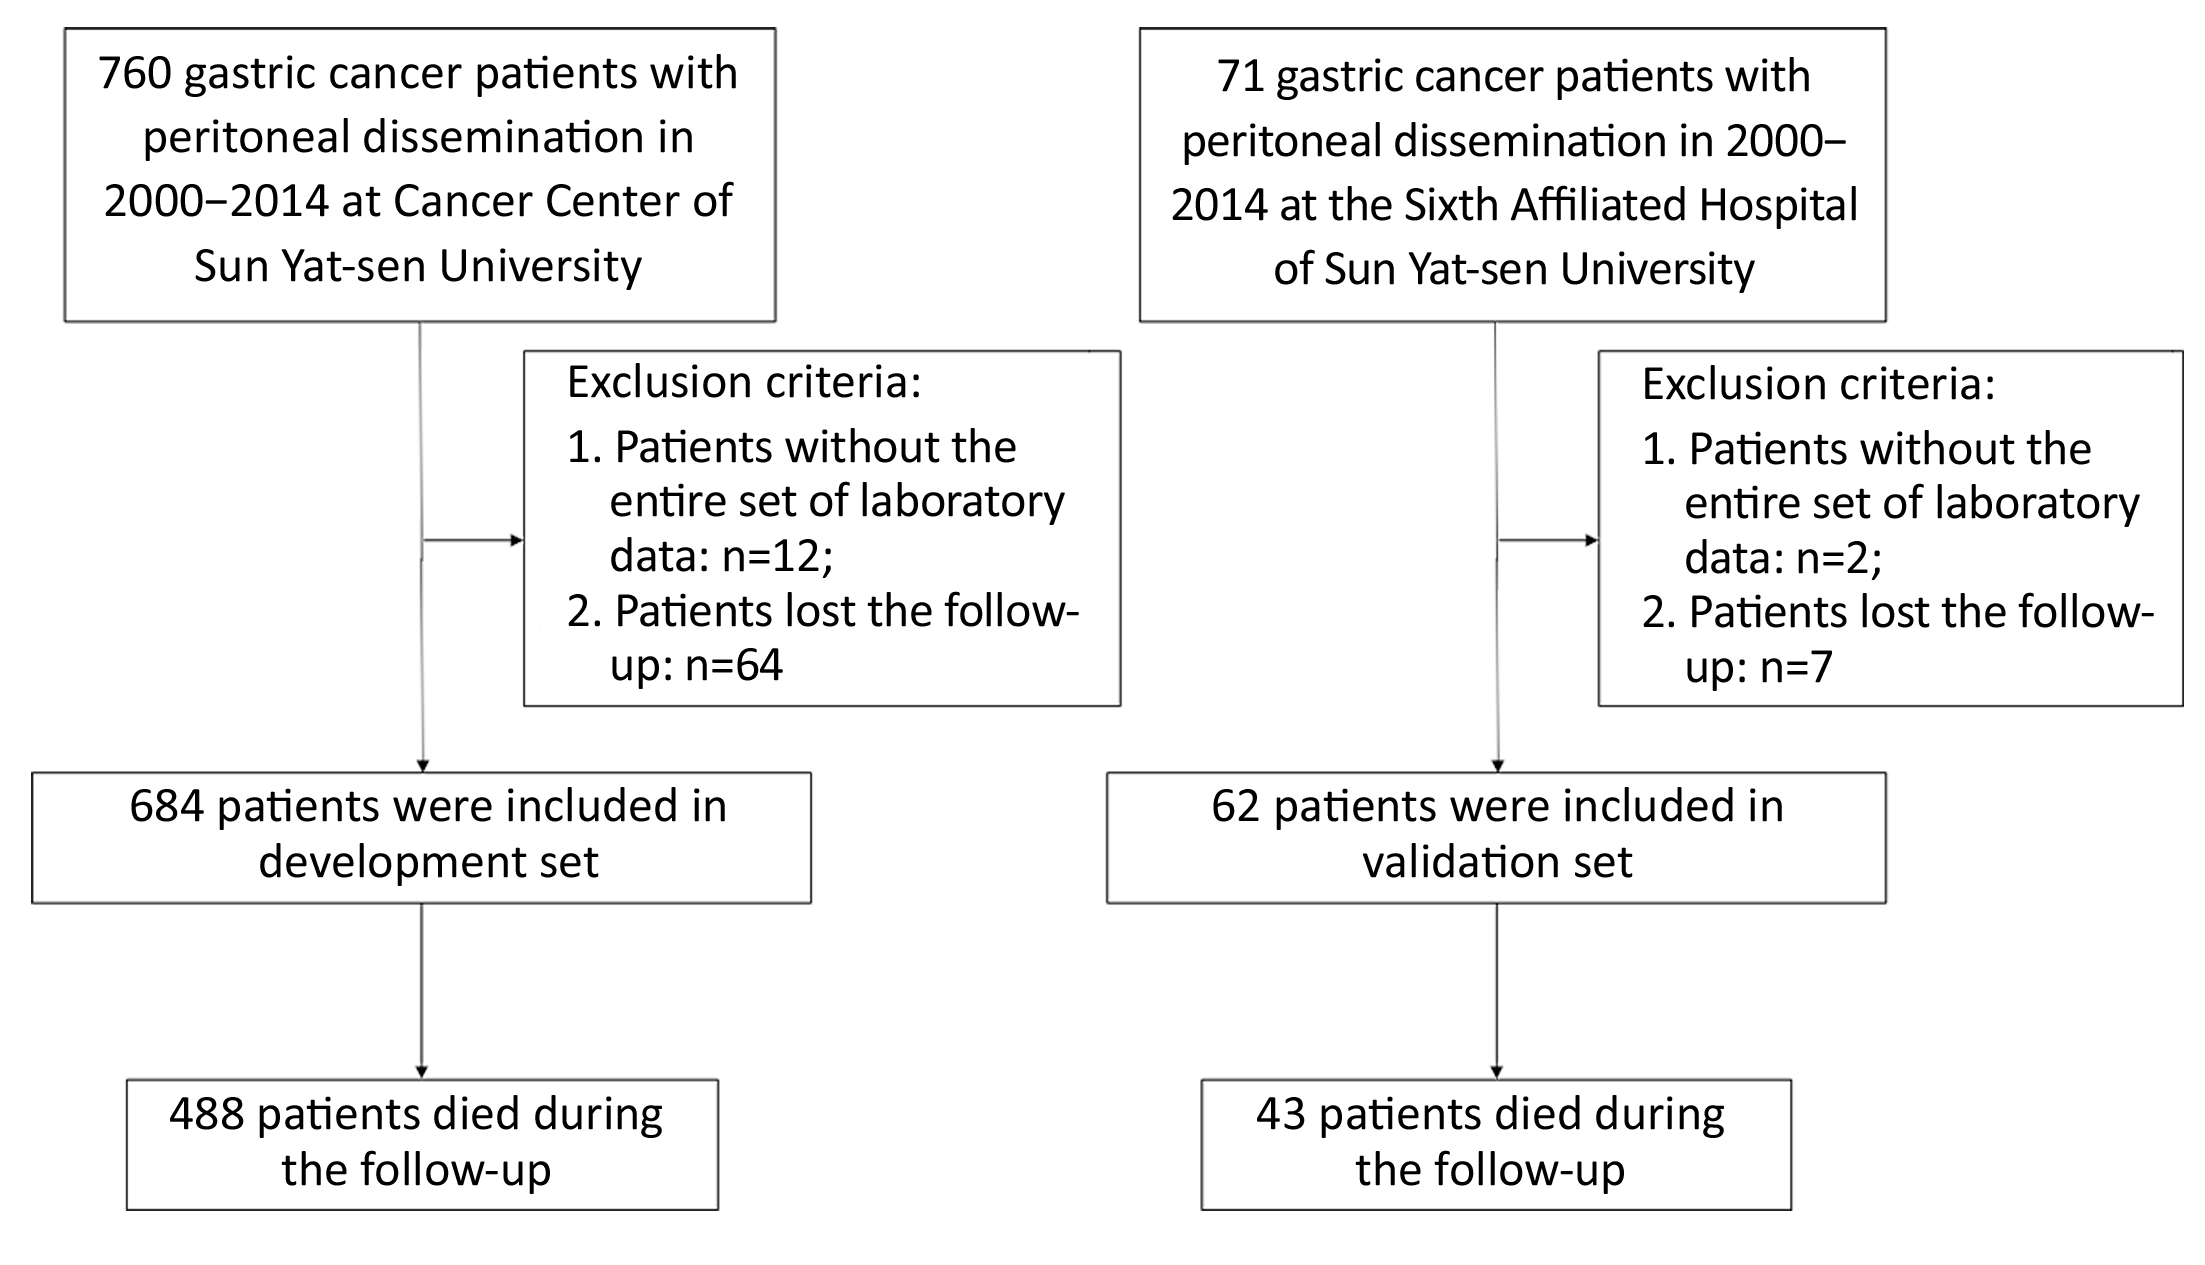
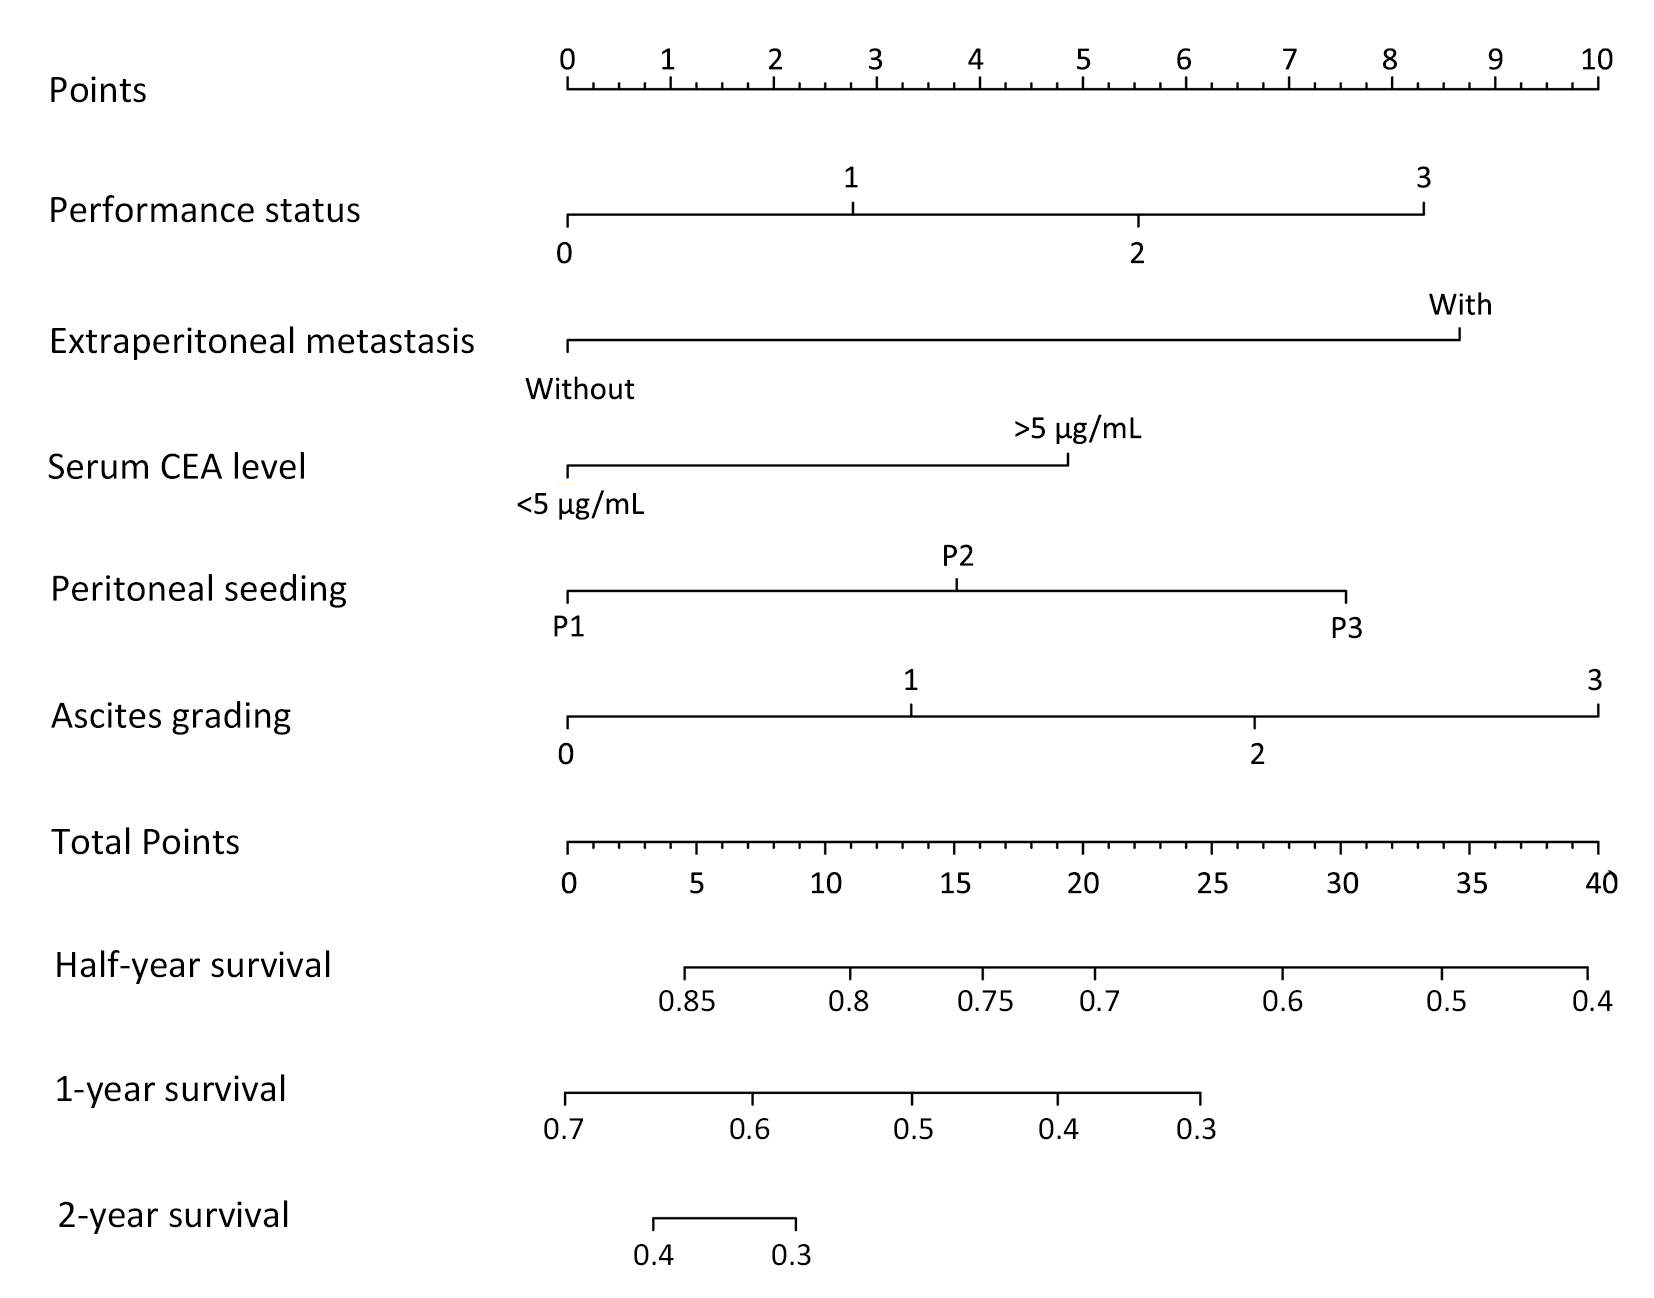
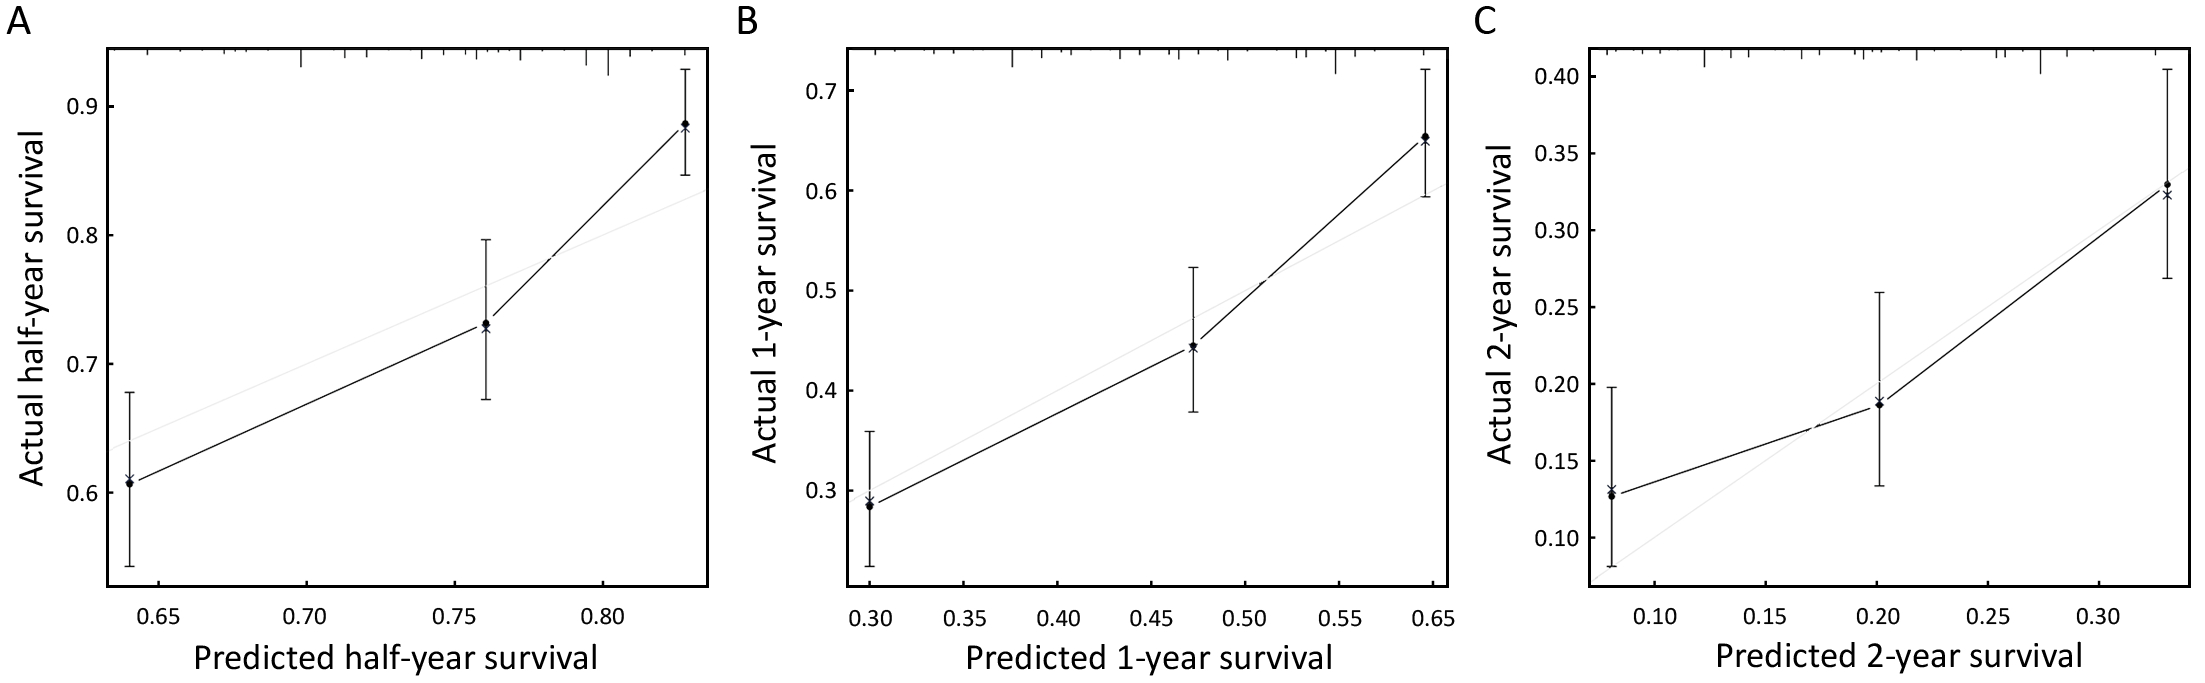
Objective To identify independent prognostic factors to be included in a nomogram to predict the prognosis of gastric cancer patients with peritoneal dissemination. Methods This is a retrospective study on 684 patients with a histological diagnosis of gastric cancer with peritoneal dissemination from the Sun Yat-sen University Cancer Center as the development set, and 62 gastric cancer patients from the Sixth Affiliated Hospital of Sun Yat-sen University as the validation group. Chi-square test and Cox regression analysis were used to compare the clinicopathological variables and the prognosis of gastric cancer patients with peritoneal dissemination. The Harrell’s concordance index (C-index) and calibration curve were determined for comparisons of predictive ability of the nomogram. Results Univariate and multivariate analyses showed that serum carcinoembryonic antigen (CEA) level (P=0.032), ascites grading (P=0.008), presence of extraperitoneal metastasis (P<0.001), seeding status (P=0.016) and performance status (P=0.009) were independent prognostic factors for gastric cancer patients with peritoneal dissemination in the development set. The nomogram model was constructed using these five factors. Internal validation showed that the C-index of the model was 0.641. For the external validation, the C-index of this model was 0.709. Conclusions We developed and validated a nomogram to predict the prognosis for gastric cancer patients with peritoneal dissemination. This nomogram may play an important clinical role in guiding palliative therapy for these types of patients, although it may need more data for optimization.
2018, 30(4): 460-467.
doi: 10.21147/j.issn.1000-9604.2018.04.09
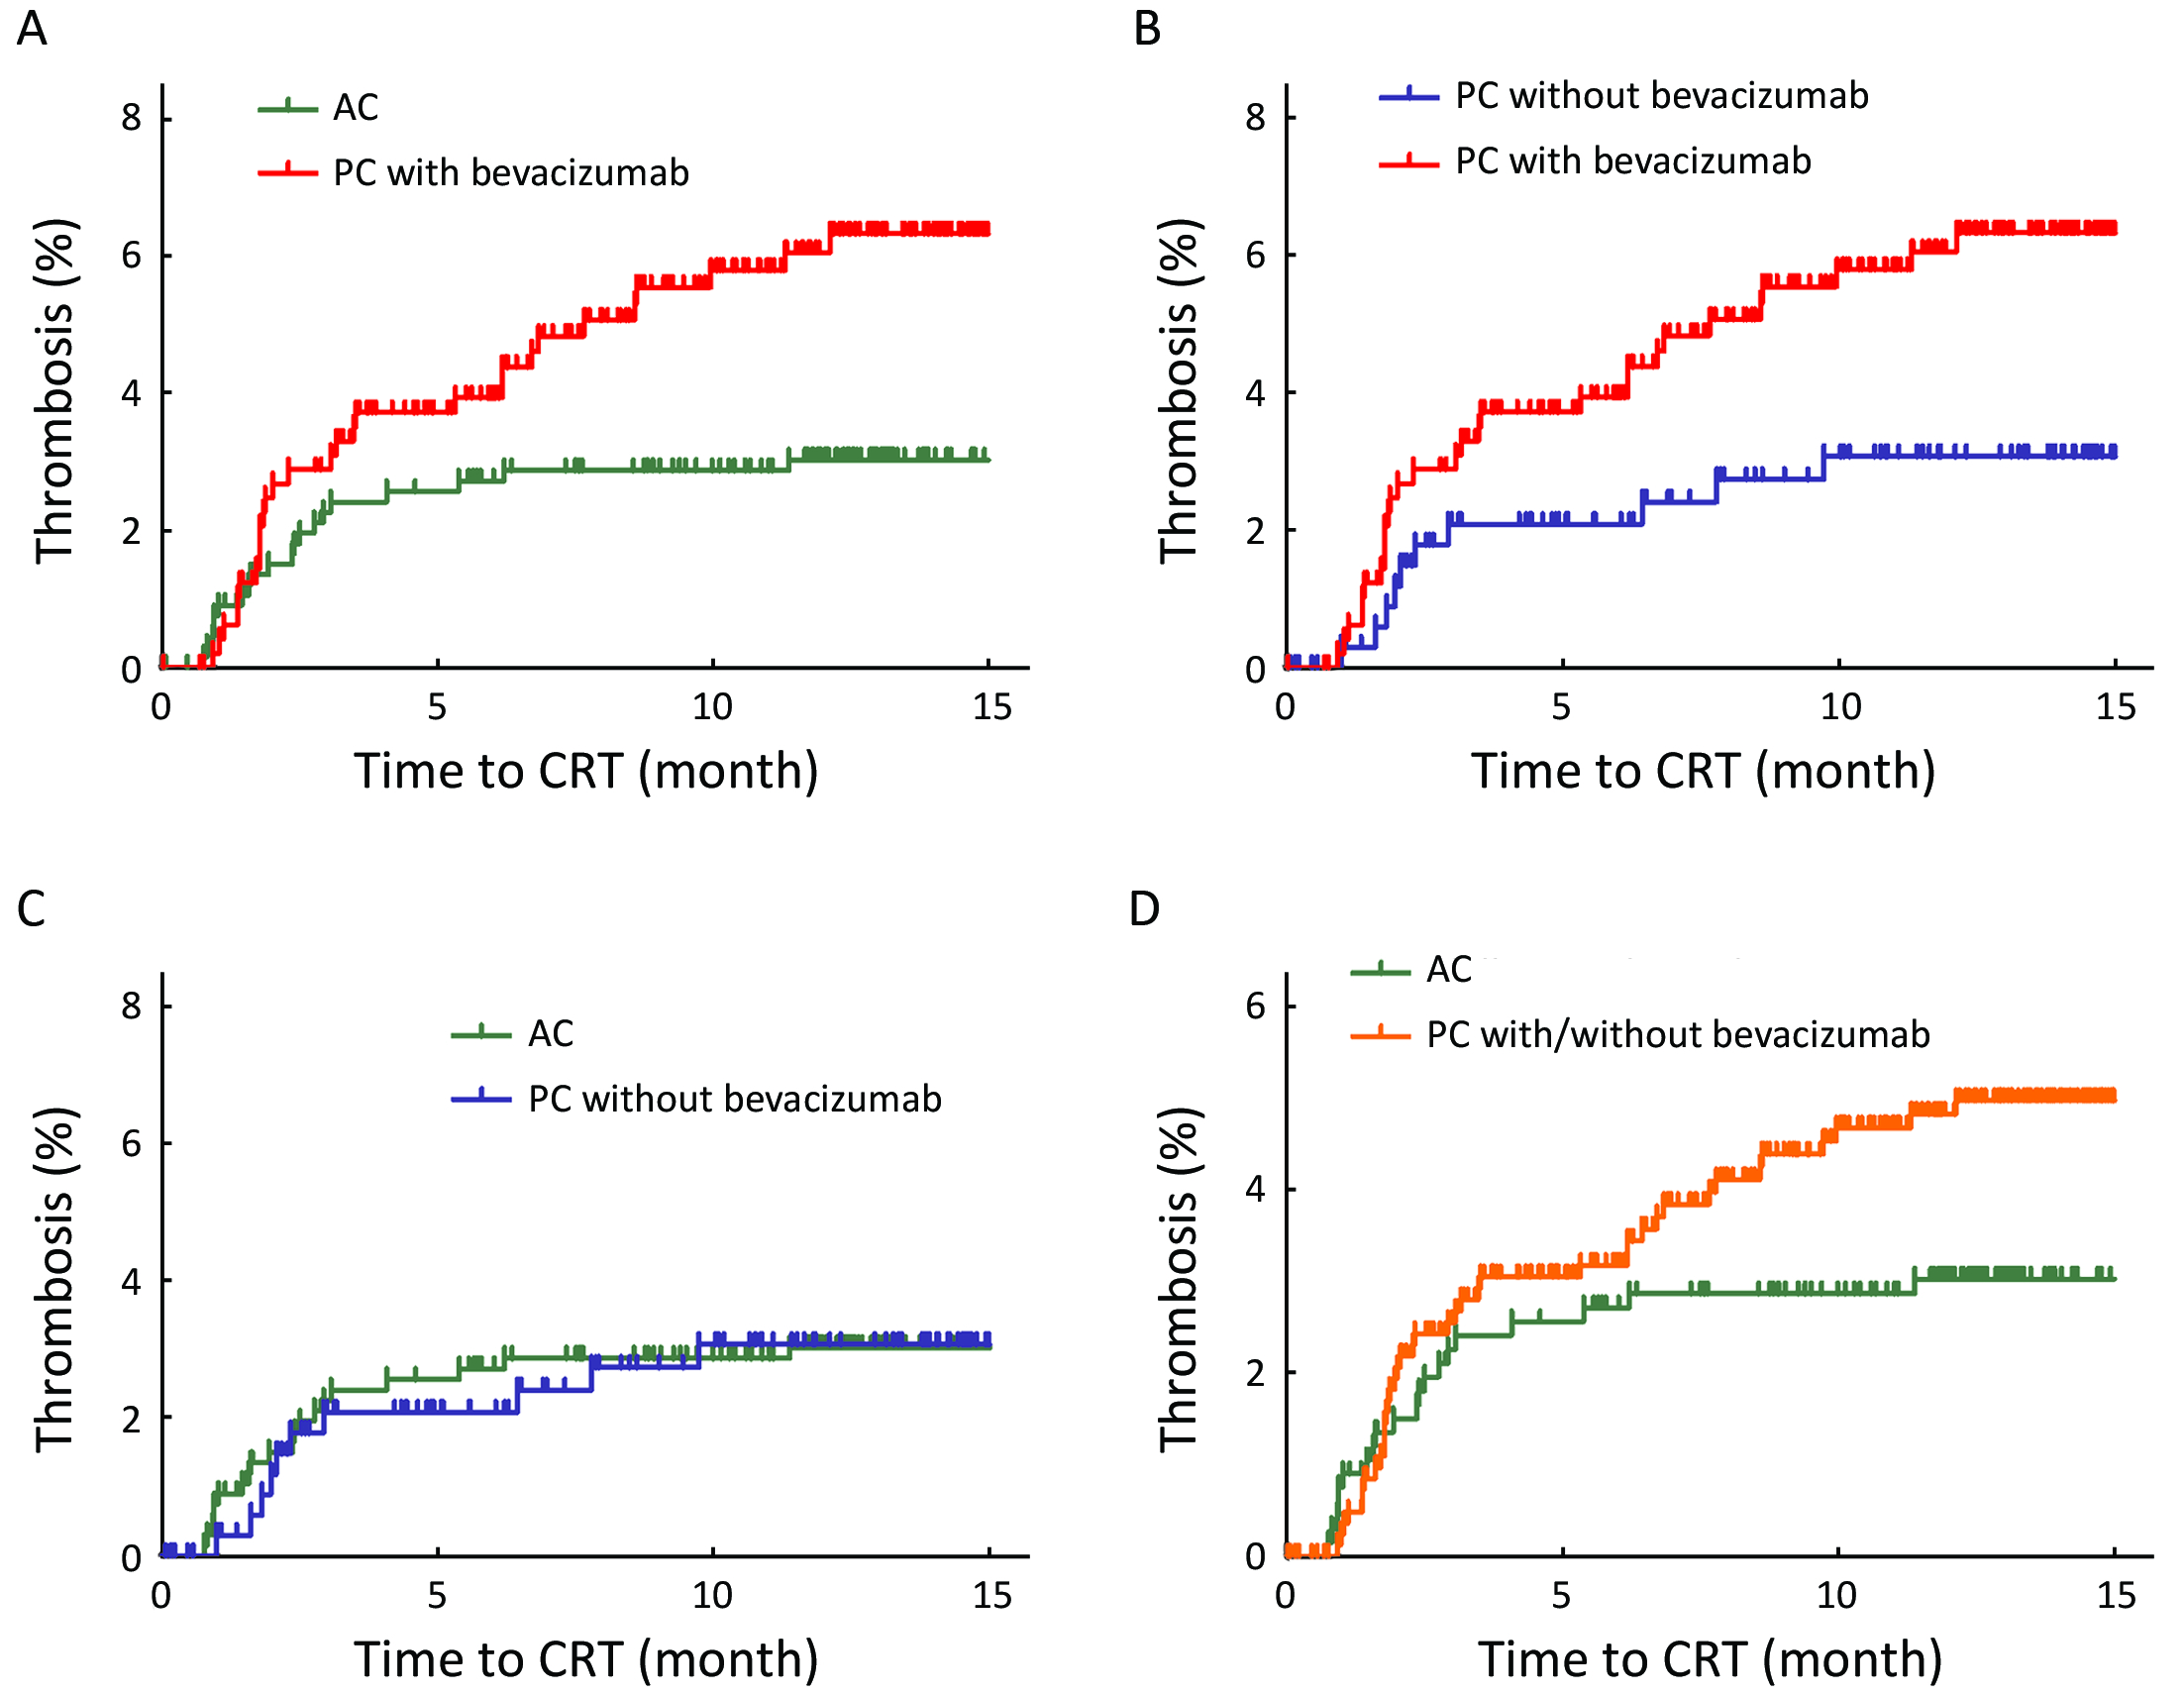
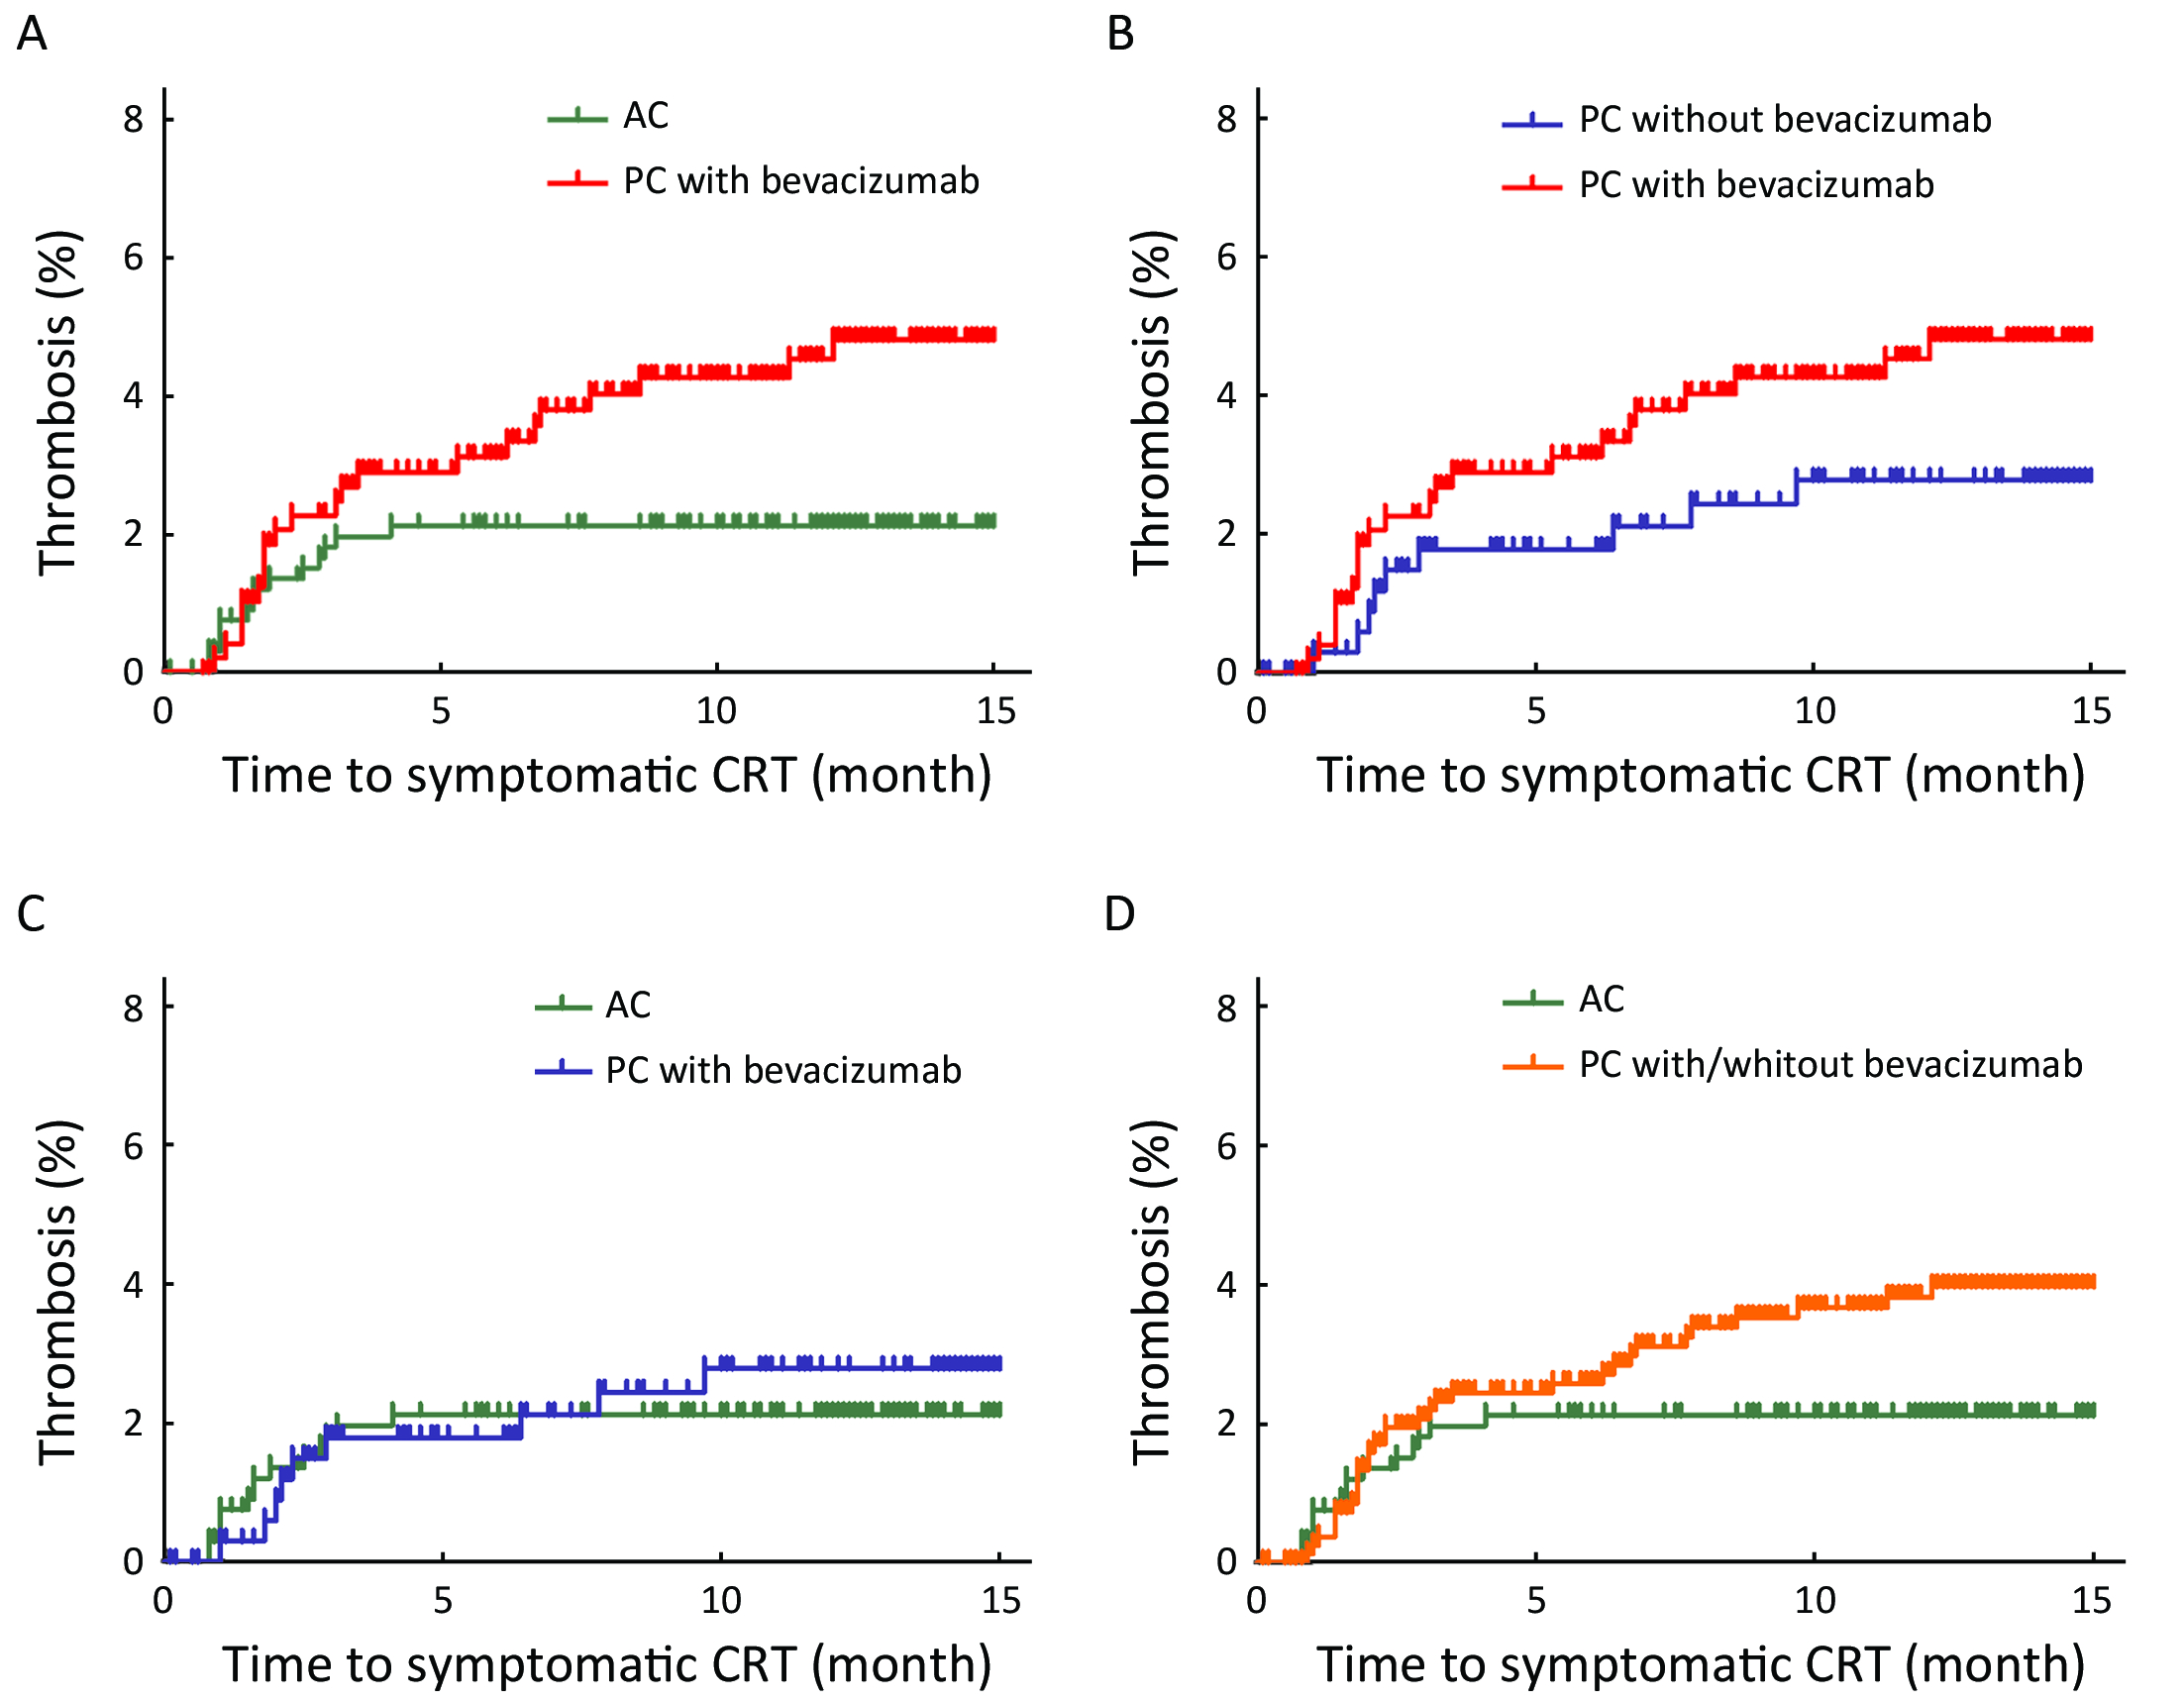
Abstract:
Objective Chemoport-related thrombosis (CRT) is a serious complication that causes morbidities and interrupts administration of intravenous cancer therapy. We investigated the incidence and risk of CRT in colorectal cancer (CRC) patients treated with bevacizumab (BEV). Methods We retrospectively reviewed 1,534 CRC patients who received chemotherapy with or without BEV using a chemoport between 2014 and 2016. Results The participants had a median age of 58 (18−85) years, and 60.3% were male. All participants were stratified into three groups: adjuvant chemotherapy (AC) (n=670), palliative chemotherapy (PC) without BEV (n=356), and PC with BEV (n=508). The median follow-up was 20.19 (interquartile range, 14.07−27.19) months. CRT occurred in 3.8% of all patients; incidence of symptomatic and asymptomatic CRT was 2.9% and 0.9%, respectively. CRT occurred more in patients with BEV (5.7%) than in patients without BEV (2.9%, P=0.008). The cumulative incidence of CRT in patients administered PC with BEV was significantly higher than that in those administered AC (P=0.011) and there was a trend toward increased CRT in patients administered PC with BEV compared with those administered PC without BEV (P=0.044). Multivariate analysis found that BEV treatment was the only variable that was significantly associated with CRT (hazard ratio, 2.06; 95% confidence interval, 1.24−3.43; P=0.006). Conclusions BEV treatment was significantly associated with increased incidence of CRT in CRC patients.
2018, 30(4): 468-476.
doi: 10.21147/j.issn.1000-9604.2018.04.10
Abstract:
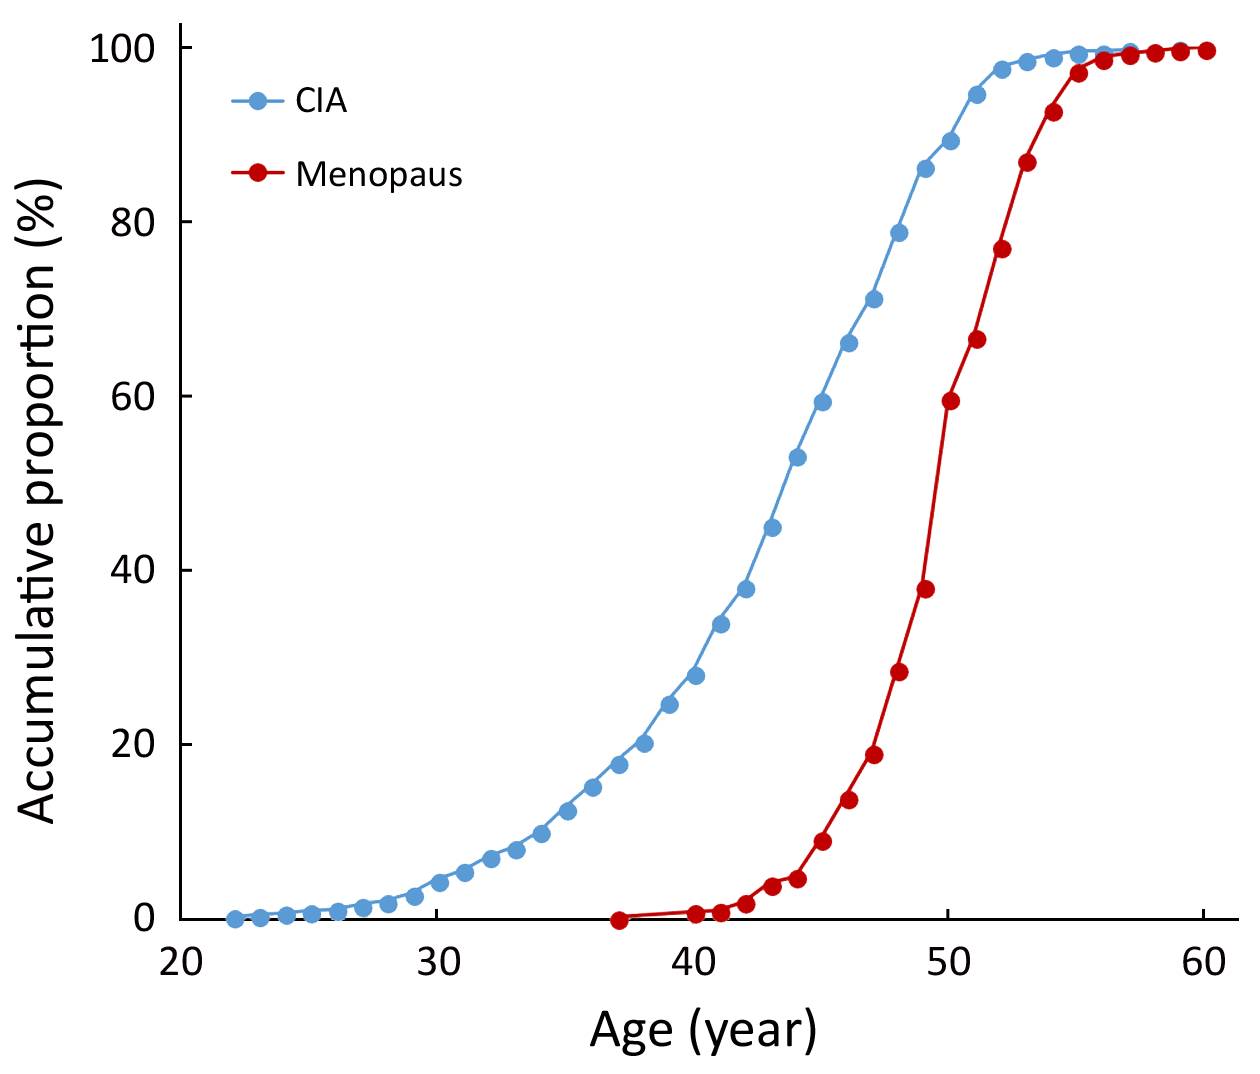
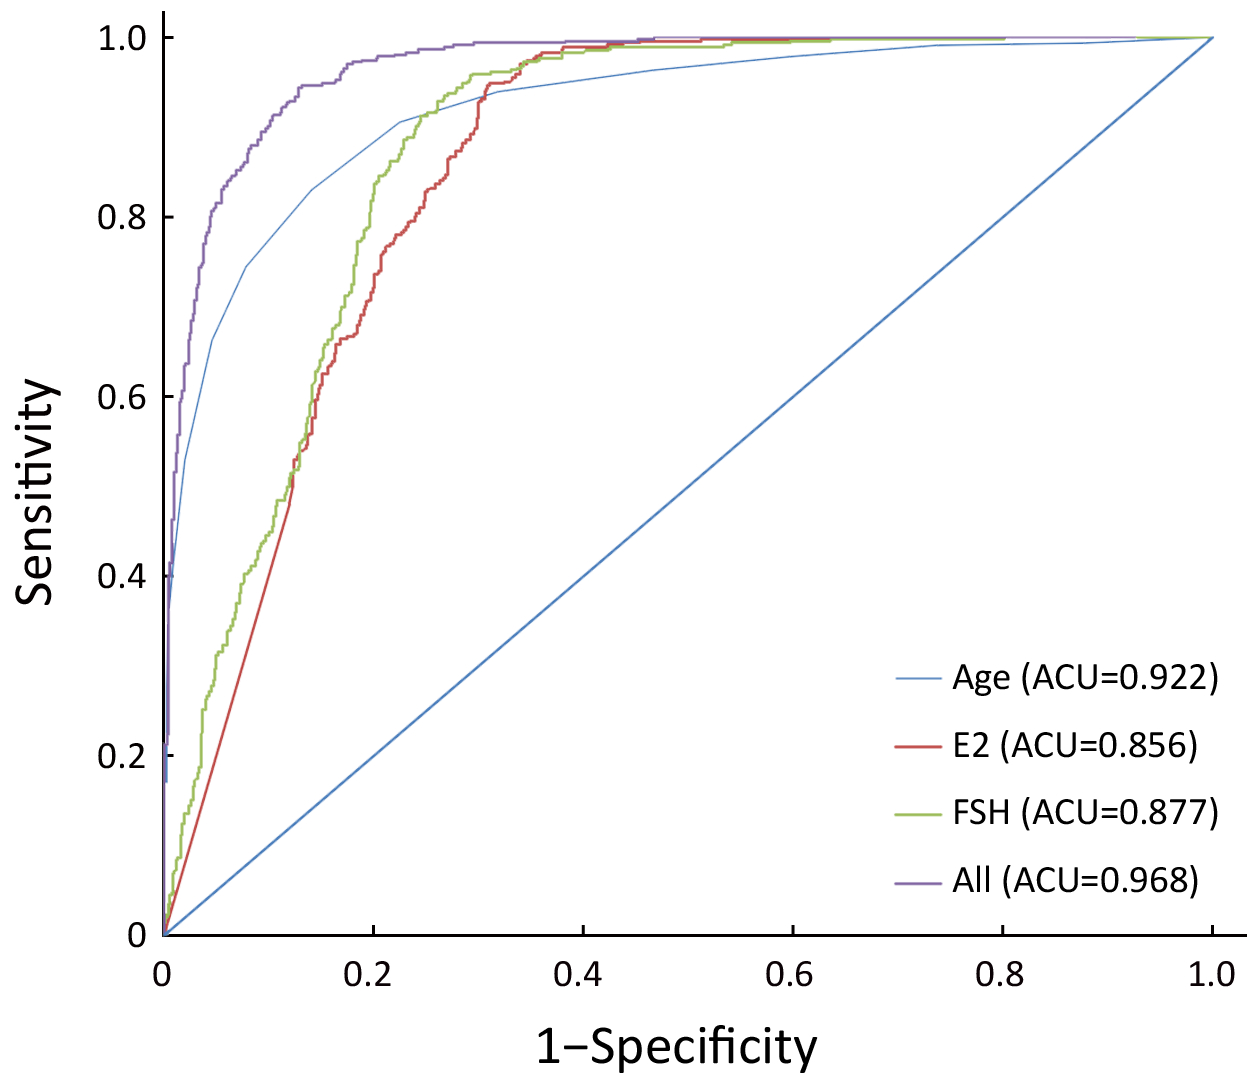
Objective In patients with chemotherapy-induced amenorrhea (CIA), the menopausal status is ambiguous and difficult to evaluate. This study aimed to establish a discriminative model to predict and classify the menopausal status of breast cancer patients with CIA. Methods This is a single center hospital-based study from 2013 to 2016. The menopausal age distribution and accumulated incidence rate of CIA are described. Multivariate models were adjusted for established and potential confounding factors including age, serum concentration of estradiol (E2) and follicle-stimulating hormone (FSH), feeding, pregnancy, parity, abortions, and body mass index (BMI). The odds ratio (OR) and 95% confidence interval (95% CI) of different risk factors were estimated. Results A total of 1,796 breast cancer patients were included in this study, among whom, 1,175 (65.42%) were premenopausal patients and 621 (34.58%) were post-menopause patients. Five hundred and fifty patients were included in CIA analysis, and a cumulative CIA rate of 81.64% was found in them. Age (OR: 1.856, 95% CI: 1.732−1.990), serum concentration of E2 (OR: 0.976, 95% CI: 0.972−0.980) and FSH (OR: 1.060, 95% CI: 1.053−1.066), and menarche age (OR: 1.074, 95% CI: 1.009−1.144) were found to be associated with the patients’ menopausal status. According to multivariate analysis, the discriminative model to predict the menopausal status is Logit (P)=−28.396+0.536Age−0.014E2+0.031FSH. The sensitivities for this model were higher than 85%, and its specificities were higher than 89%. Conclusions The discriminative model obtained from this study for predicting menstrual state is important for premenopausal patients with CIA. This model has high specificity and sensitivity and should be prudently used.